Tables
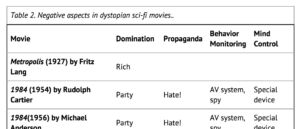
Tables are a more accessible way to display data or other structured information than an image. The magazine style sheet automatically formats tables in a consistent style.

- Like figures, tables are numbered and have a reference in the text.
- All tables have a caption, which is displayed above the table.
- Tables are coded with header rows and columns, which are displayed in bold type.
- Do not include merged cells, as they cause accessibility problems.
In the article manuscript, include any tables using the Word function.
Charts and data visualization
Any charts or data visualization images must have alternative text, just like any other figure, but they also need a “long description” so the point is made clearly to people who cannot see the image. There are no easy rules for how to do this. Some options are:
- A table below the figure, presenting the data points.
- A list or other description of the visual impact of the image, to go in a box at the end of the article.
- A link to the data source or a detailed description in an accessible format.
