…an existing chat app, WeChat, as a diary tool during a series of mobile diary studies that focused on understanding how Chinese consumers go about their banking and financial activities…
…Analyzing diary entries is time consuming. This activity takes even more time in the case of a pen-and-paper diary. Designing a Diary Study Eliciting Diary Entries There are three categories…
…insights into aspiration vs. reality, and I had a lot of fun in the process. Diary research can lead to deeper insights from your respondents. But creating a great diary…
…to the research in general and how they understood their participation in our studies. Older participants were highly committed to the research Our participants took their involvement in our studies…
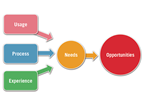
…it is a diary maintained by a user over several days or weeks. Typically, the diary includes photographs taken by the user, pictures cut from magazines, voice recordings, and written…
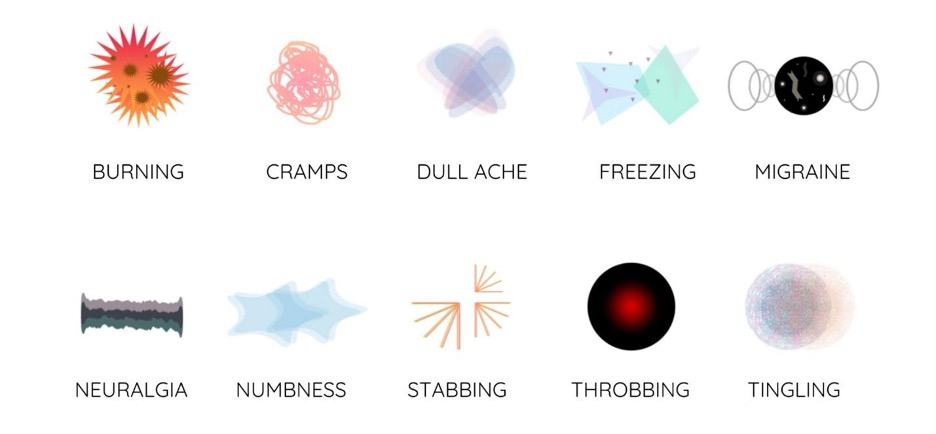
…and their healthcare providers (HCPs), family and friends, and the general public. Pain Diary To begin with, I maintained a visual pain diary over four weeks (Figure 3). A pain…
…studies looking at how peoples’ television viewing and planning habits might influence and inform the design of future program guides. Such studies often result in design guidelines and recommendations. However,…
…insight is the use of a diary. During the contextual inquiry sessions, you may consider asking employees to submit a diary for the study. The employees could submit entries daily…
…supports a six-week cognitive behavioral therapy (CBT) intervention for depression. Mobile Mood Diary Therapists, particularly those practicing CBT, often ask clients to complete paper-based mood charts, but adherence can be…
…studies “in the wild” using a robust platform that collects data from the users, their actions and environment, and even handles compensation, recording, and event and task scheduling? And what…