The progression of UX research methods has led us closer and closer to getting the real, genuine user experience. User testing improved on the methodology of focus groups, trading discussion for observation and putting usability at the center. Remote user testing technology has removed much of the artificiality of lab testing, allowing users to re-create more representative experiences from their own homes on their own devices.
What’s the next step? How do we get even closer to understanding the user experience on our products? Big data may hold the answer.
Cloud-Based UX Tools and the Problem of Scale
Cloud-based online tools for doing UX research have taken a small first step in the right direction: Remote user testing companies like ours, for example, offload much of the specialized work of conducting usability studies and enable companies to regularly collect usability data.
However, these tools tend to operate at the small scale of 5 –15 participants. Forays into crowdsourcing or big data methods have been rare, and often accessible only to enterprise firms with huge budgets and well-staffed UX departments.
Furthermore, the centrality of qualitative observation to UX work means that large datasets inherently have a high barrier to analysis. Video minutes add up fast; just 10 user tests could take five or more hours to watch (shown conceptually in Figure 1).

Some tools provide quantitative data or mixed qualitative/quantitative data like heat maps, clickstreams, and eye tracking, but without heavy-duty qualitative/descriptive data like user videos. All these are still “what” tools, not “why” tools. On their own, they do not show why users do what they do. They cannot expose the emotions and stories of the real user experience.
The Right Big Data for the Job
Which data is the big data that can benefit the UX researcher? Which big data shows “why,” and can be analyzed in a timely and useful way?
There is a treasure trove right under our noses: behavioral data.
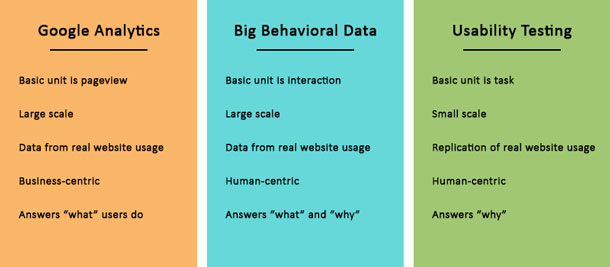
Users’ behaviors on a website form the core of the user experience. Currently, the tools we use to track and understand website usage (like Google Analytics) use the pageview as the basic unit of a user session. For users, though, pages are generally not the building blocks of their experience.
Interactions—clicks, taps, scrolls, zooms, mouse movements, keyboard input, navigation—are what make the experience. Interactions provoke emotions in the user. An obvious, pleasing, smooth interaction provokes joy; a confusing, complex one causes frustration or anxiety. The accumulation of a user’s emotional responses to all these little moments are a chief factor in how the user will ultimately feel about your website.
By observing the way users interact with a website, or any user interface, we can define their behavior and tell the story of their experience. Distinct interaction events (for example, Javascript events) tell a whole story of user behaviors that can be mined for insights and patterns. All it takes is to collect the usage data from every single session (say, all the Javascript events from all your website sessions, shown in Figure 2), and see what behaviors users engage in as they use a product or service.

The great thing about behavioral data is that it tells both qualitative and quantitative stories. Because of the broad similarity of the types of behaviors people engage in, it’s possible to look at behavioral trends on a huge scale—hundreds or thousands of participants—and analyze what these trends mean.
If we can generalize patterns of behavior and then identify them in the usage data, it’s possible to learn more about how people really use our websites than can ever be derived from Google Analytics.
A good example of a generalized behavioral pattern is the “rage click,” in which users click rapidly and repeatedly on an unresponsive element (more on rage clicks later). By recognizing rage clicks as a recurring behavioral pattern and then identifying the interaction sequences that mark rage clicking, the behavior can be observed on a large scale.
That’s the big data that will improve the work of the UX professional—the data that answers the question, “What exactly are people doing on our websites?”
What Does Big Behavioral Data Look Like?
By capturing user session data, for example with Javascript events, we can essentially rebuild each session as a video, indexed by behaviors including clicks, scrolls, navigations, and more. Thus, every session can be available to review as video content or a log of interactions, shown in Figure 3.
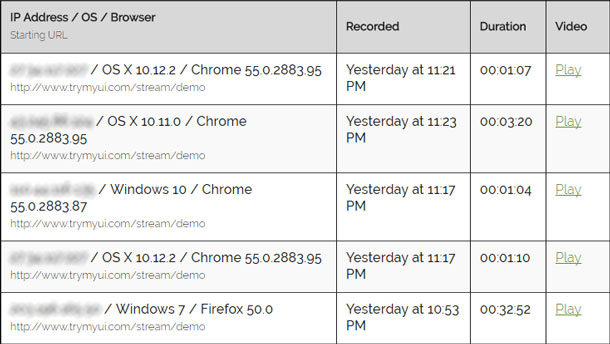
While this means the UX researcher faces a mountain of time-consuming video, it is indexed to the smallest detail and thus highly searchable. Behaviors can also be algorithmically detected so that the researcher knows exactly which sessions to watch and where.
So, for example, after capturing thousands of user sessions the researcher might identify the sessions containing rage clicks, and watch only those; or, if analytics have shown that a problem exists on page Y, he might watch only sessions that included that page to look for the issue.
5 Things to Learn By Capturing User Behavior Data
The challenge with big data is finding a useful, efficient way to harness it and learn from it. Here are five things we can do by collecting big behavioral data from user sessions:
- Better understand how people are really using a website
- Identify common behavioral patterns and extrapolate UX and usability issues
- Eliminate causes of user frustration quickly
- Prevent conversion-killing issues from persisting unnoticed
- Drive the agenda for deeper, targeted research studies that reflect actual usability needs
Each of these furthers the goal of the UX professional in building and maintaining a website that is easy to use, tolerant, and serves the needs of users.
1. Understanding actual website usage
How is this kind of data different from something like Google Analytics? These web analytics tools show where people go, what paths they follow, which page they landed and exited on, but they don’t show you the experience.
Experiences are composed of interactions, not a series of pages. The way the users interact with what’s on each page will define their experience, but that kind of behavioral data is below the threshold of what Google Analytics will show you (see Figure 4).
Big behavioral data, like usability testing, can show you qualitative insights about usability issues that go below the surface of page views and conversion flows: ways that people use pages or tools differently than you expect, and ways they react or respond to UI elements differently than you imagine.
Another benefit big behavioral data shares with usability testing is the ability to watch complete sessions as video, from beginning to end. This helps the UX researcher process the user experience in human terms—as an individual’s story. It is also useful for showing stakeholders potential pain points to persuade them of the wisdom of particular design proposals.
Big behavioral data is also different from usability testing, however, because:
- It’s taken directly from actual website usage, and therefore real.
The artificial sheen of user testing, which attempts to replicate a genuine user experience, is removed completely. Even remote tools, where users test on their own devices from their own homes or workplaces, do not fully achieve this. - You have many more sessions to look at.
User testing studies typically don’t exceed the range of 5 – 50 tests. With a library of every single user session in front of you, you can make reliable, statistically sound UX judgments based on thousands of data points.
2. Identify common behavioral patterns, extrapolate UX issues
The ways people interact with online interfaces obviously varies from person to person (for example, “active” mouse users who drag the cursor all around the page tracing every action and exploring every corner, versus “passive” mouse users who tend to leave the cursor idle while they explore with their eyes). Yet, there are many identifiable behavior patterns that all or most people engage in.
This fact of shared behaviors across a broad spectrum of users is the most important key to interpreting big behavioral data, and then using large scale analysis to improve UX research methods. Two steps can help us to harness it:
- Single out behaviors that suggest problems, frustration, or confusion.
- Figure out how can they be machine-identified from a massive dataset.
Rage click
Take, for example, the rage click.
Even if you’ve never heard it called this before, you know the behavior. You click a link, a button, an image… And nothing happens. You give it a second. Still nothing? You click again–then again, then again and again in a rapid barrage.
This basically subconscious response is an example of a nearly universal user behavior that clearly indicates the user’s frustration and anxiety.
It can also be easily identified with a few parameters: all instances of, say, 3 or more clicks in a span of perhaps 1 second or less. Whatever those numbers are, they can be tested and optimized for accuracy, until a pattern-matching tool can reliably categorize all such behaviors as rage clicks.
What does a pattern of rage clicking tell you? Either you have a bug or a usability issue. If your users are trying to click an element that’s not actually clickable, you’re likely facing inconsistency in your visual language that has led people to misinterpret that element. It may also indicate that a page or interface is missing something that users are looking for, causing them to click on anything out of desperation.
More behaviors
Other behaviors can be identified by similar means.
Mouse-related behaviors (like random/wild patterns, hesitation patterns, and reading patterns) can indicate impatience, high difficulty level or cognitive load, or high concentration levels.
Scrolling behaviors, such as random scrolling (rapid up and down), can hold insights about your scent of information. Are users scrolling through lots of content they find irrelevant to their purposes? Are they struggling to find the right information or calls to action?
Telltale navigation behaviors include backtracking and the related pattern of pogo-sticking (repetitive back-and-forth navigations between one “hub” page and many “spokes”).
Navigation actions can be interpreted, according to some behavioral models, as either forward movement or impasse. In other words, did the user get closer to a goal or take a wrong turn? When someone backtracks, what signs pointed them in that wrong direction? (Or, is it just an exploration style? Does your information architecture force excessive clicking?)
All these behavior patterns, and more, can be defined with quantifiable parameters and used to learn more about the user experience.
3. Eliminate bad UX quickly
Once parameters are in place (even better if they are self-improving with artificial intelligence), you can immediately see each instance of these user frustrations and watch why it happened.
Then, you can act quickly to either fix what caused the user frustration, or launch into deeper research on the issues discovered, depending on what the situation demands. In many cases, other types of research (like user testing) will be necessary, or at least helpful, to add understanding and clarity to the issue.
4. Prevent conversion-killers from hiding in the shadows
UX issues are always hiding among the conversion pathways of our websites—nothing is ever optimized to perfection. But silent conversion killers like a broken button or an information disconnect can be lurking without our knowledge.
With session-capture technology, we can be constantly watching for these problems so they don’t persist for months and bring down conversions, signups, sales—whatever goal you have for your website.
In the words of Disney’s Pocahontas: “You’ll learn things you never knew you never knew.”
5. Drive smarter, targeted research that reflects real needs
One of the biggest issues with usability testing is that people don’t know what to test. So, they test the new feature; the old pages that are up for a redesign; the pet project. What about the rest of the site? How do you know where the big bad issues are?
Big behavioral data methods look at the whole website, collecting all the usage data to show you exactly where the issues actually are. They point you in the right direction.
Here’s an example from our own experience. We regularly run tests on the new prototypes and flows we create, and on the old ones we want to redo. However, when we implemented our own session-capture technology on our website, we discovered instances of rage clicking on an important page we hadn’t been testing: our pricing page. It seemed some users thought bolded feature names under our plan types were clickable.
Clearly this represented a usability issue; users were misinterpreting our visual communication, believing that the bold font of these elements implied they were clickable.
We ran user tests to get a better understanding, and from this feedback we discovered a more fundamental disconnect on our marketing pages between information about our features and our plans.
The plans page lacked sufficient descriptions of our features for users to adequately appreciate what they were getting. Meanwhile, the features page lacked the necessary integration with information about our plans to tie together these two important pieces of information.
We also looked at navigation data on Google Analytics and noticed some patterns that confirmed this problem. The flow of traffic from the plans page to the features page was actually 29.7% higher than the flow of traffic from features to plans. As plans is one of our most important conversion pages, this meant that a lot of users were essentially going backwards in the flow due to this information disconnect.
This kicked off a re-evaluation of how we communicated about our features and plans to new users, and we are currently renovating the way we approach this information to improve users’ understanding and increase conversions.
Relying on user behavioral data to inform UX research and strategy is for the most part new, yet a logical step in getting closer to understanding the true, real experiences of people using our designs.