
A DoGo map is a lightweight tool that provides an overview of the information architecture (IA) of a website or system. By blending a site map with a flowchart, a DoGo map creates an efficient way for the team to maintain a high-level understanding of how the system fits together. Using this tool (shown in Figure 1), the UX designer can invite other team members to understand how and where a new feature or piece of content fits into a system. It also provides a simple structure for a development team to collaborate on a system’s IA. This collaboration enables the UX designer to get his or her ideas into the world without a lot of heavy documentation.
How It Works
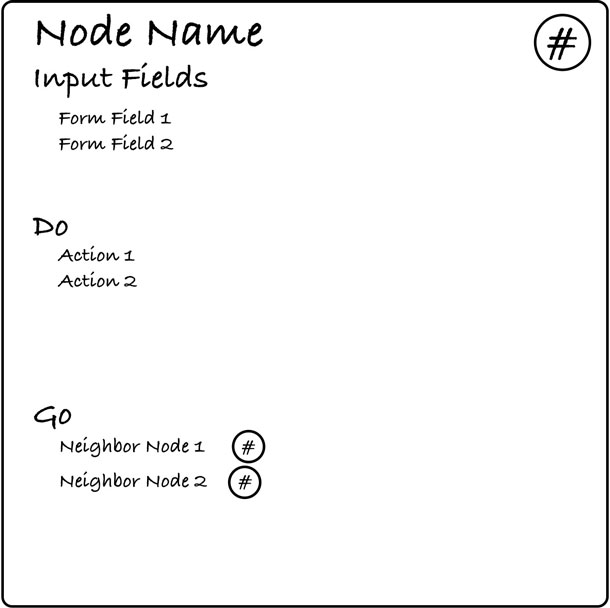
Each node in the DoGo map specifies both the actions supported on the page or view (for example, What a user can Do) and where the user can/will go from that page (Where a user can Go) (Figure 2). This, combined with one special fork-shaped symbol to support user flow, provides a lightweight method for designing and testing a site before detailed designs and prototypes are created.
Index cards are used to document each node of a DoGo map, where the nodes represent a page or view within a system. The index card contains five important pieces of information:
- Name: descriptive label for the node (screen/page)
- Reference Number: quick reference for a node
- Input Fields: important form fields
- Do: actions for the screen
- Go: neighbors, or where you can go from this node
The name of the node is most often a noun that summarizes the collection of data or actions presented on the screen.
The reference number is used as a handle to easily connect one node to another. Typically, the nodes are numbered sequentially, but order doesn’t actually matter because as the map changes, new cards will be introduced and the order becomes useless. What is important is consistency and ensuring that the reference numbers aren’t duplicated, as this helps prevent confusion later on.
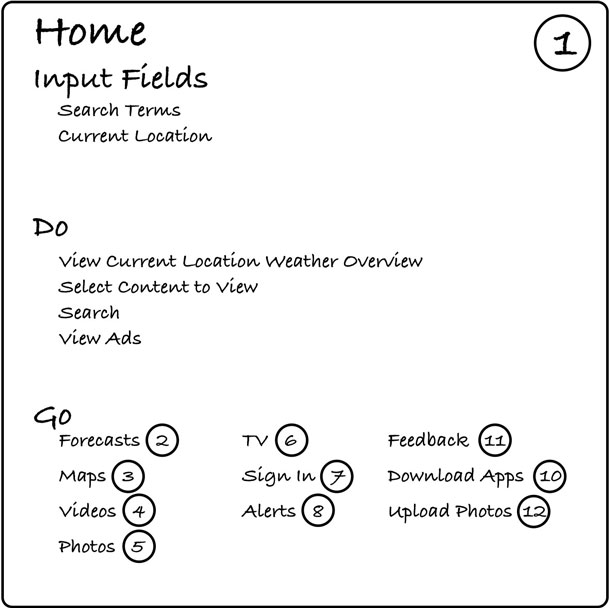
As you design the system, consider what a user will want to do on a given screen. Write these actions in the “Do” section of the card, preferably as a concise verb-noun statement (for example, “Enter location info” or “View message detail”). In the “Input Fields” section at the top of the card, write the form fields that will be required to support the actions listed in the “Do” section. Also consider where a user will want to go from this screen, and write these neighbors and their reference numbers under the “Go” section (Figure 3).
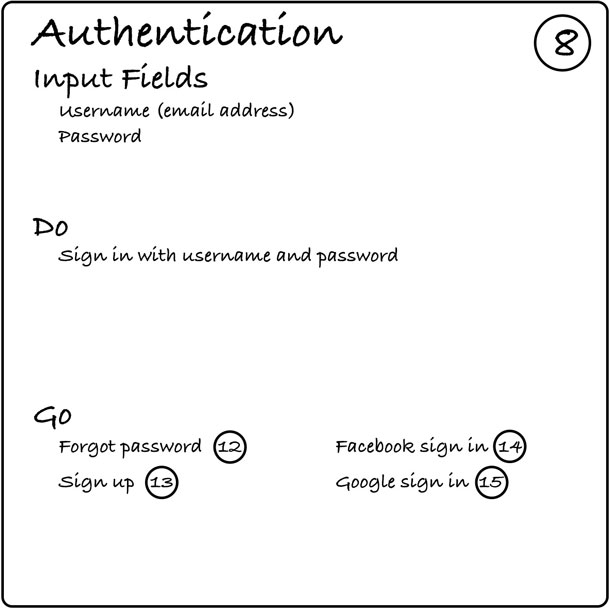
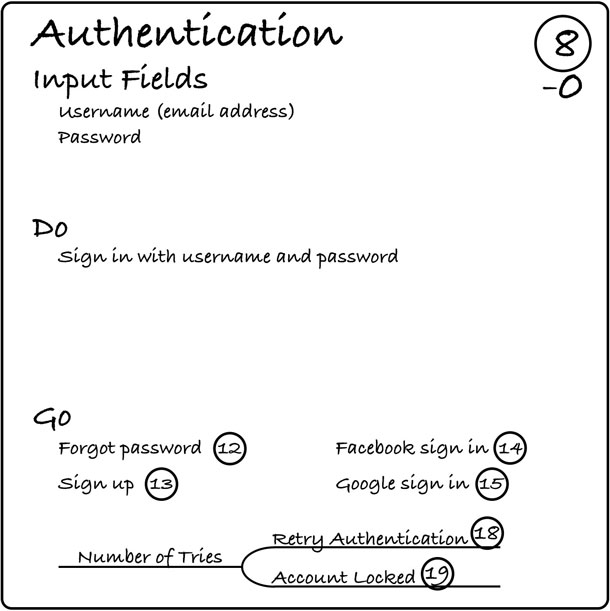
Consider a simple Authentication page. Users can sign-in with a user name and password. They can also go to screens to recover their password, sign-up for the service, or to screens to sign-in with Facebook or Google. This is illustrated in Figure 4.
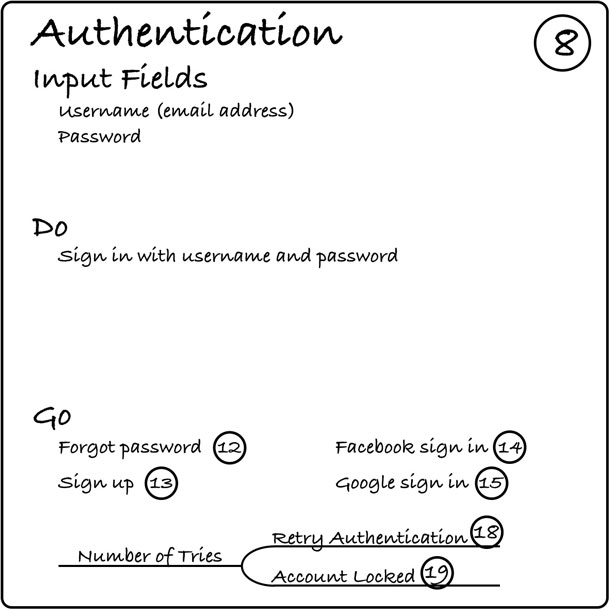
If the value of a field determines the neighbor that will be viewed next, use a fork-shaped symbol to specify the field and value that direct the next view (Figure 5). Continuing the Authentication example, if you want to add a feature to lock an account after a certain number of tries, adding the fork symbol that indicates the user will go to a Retry screen until the number of tries has been exceeded, and then they will be presented with the Account Locked screen.
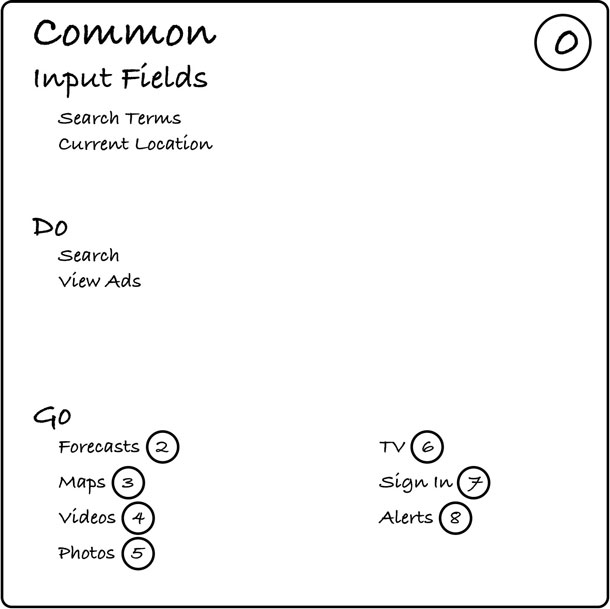
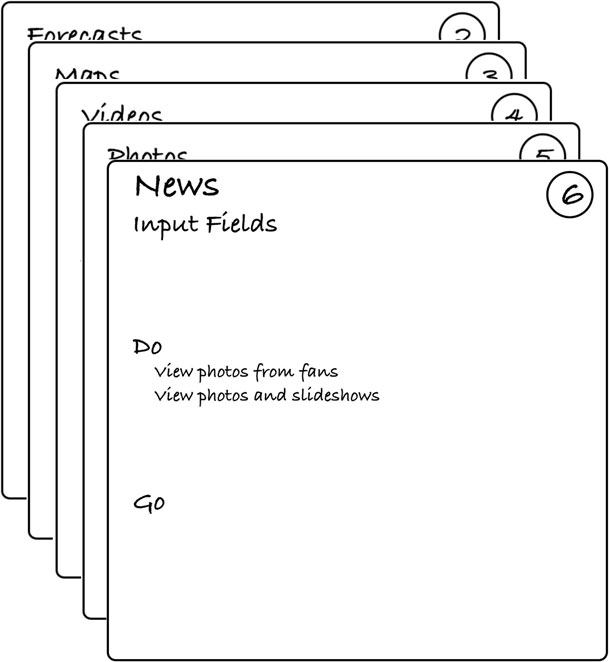
A card labeled “Common” is used to capture all of the form fields, actions, and neighbors that a user would want on most (or all) of the screens in a system. For example, a search feature that sits in the primary navigation of a site would have the field parameter of “search term,” the action of “search” in the Do section, and the neighbor of “search results” listed in the Go section. There is no need to note this common set of functionality on every card, so this would be captured on the “Common” card.
Consider the Home page example in Figure 3. Much of the functionality on this node is common across all of weather.com. Rather than writing these entries on all nodes in the whole map, the common entries are noted on the common card (Figure 6).
Once you have the Common card and a set of nodes, you can attach them to a whiteboard and draw lines to connect all of the cards referenced in their respective “Go” sections. User scenarios can then be run through the map to test the overall flow of the system.
When a team has a dedicated war room, the map can hang on a wall throughout a project. Otherwise, the reference numbers on the cards provide a nice way to quickly recreate the map on a whiteboard. As features are added, you can add elements to existing cards, add new cards, throw cards out, and rework the map.
How to Create a DoGo Map
Follow the directions below to develop an initial DoGo Map of your system. When you finish, test your map by running a few user scenarios through it. As you do, you may find yourself crossing things out, reworking flows, and throwing cards out entirely. Keep testing the flow until you are satisfied that the map reflects the general flow of the system. Then use this map as an invitation to a conversation with your team. (The example below is from Weather.com).
Gather your materials
Get a package of notecards and a pen. While the size of the notecards doesn’t matter directly to the technique, 4” x 6” (10cm x 15cm) cards are a good size. To create the map, it is helpful—but not essential—to have a large whiteboard handy.
Create the cards
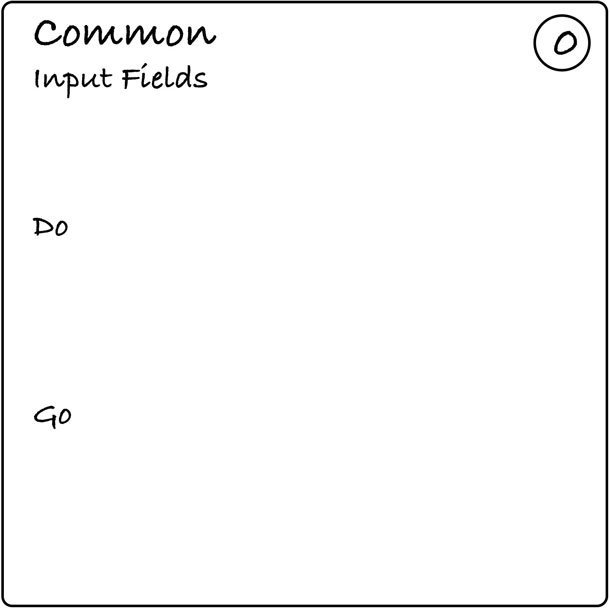
Create the Common card by labeling a card in the upper left corner as “Common.” Use a unique reference number on the card in the top right corner. I usually number this card with a 0 (zero) (Figure 7).
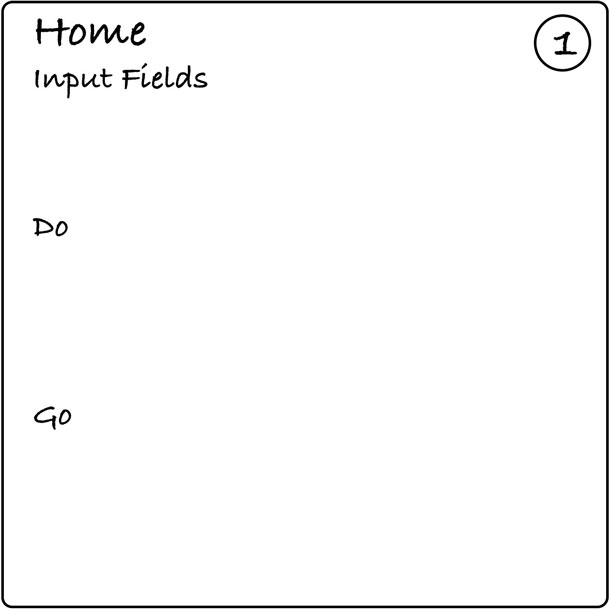
Set up a page card by taking another card that will represent a page or view in your system. Name the card in the top left corner. Write a unique reference number on the card in the top right corner. Down the left side of the card, place a heading for “Do” and “Go.”
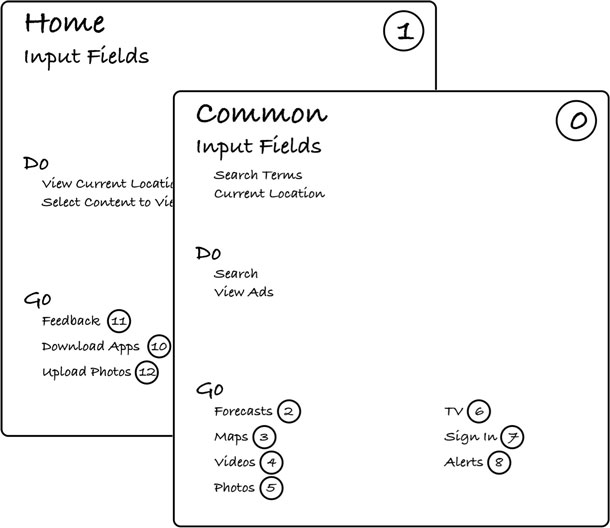
Fill out the page card by writing the actions the user will perform under the “Do” heading. Note any significant data entry fields that will support the actions. Under the “Go” heading, write the names and reference numbers of neighbor pages to which users can navigate from the current page. Add common elements to the Common card (Figure 9).
Create a card for each of the pages identified under the “Go” headings of the first card, and repeat until all cards have been completed (Figure 10).
As each card is filled out, be sure to update existing cards with new ideas and data fields that need to be captured. Continue to add to the Common card as needed. Use a minus (-) symbol with the Common card reference (Figure 11).
Draw the map
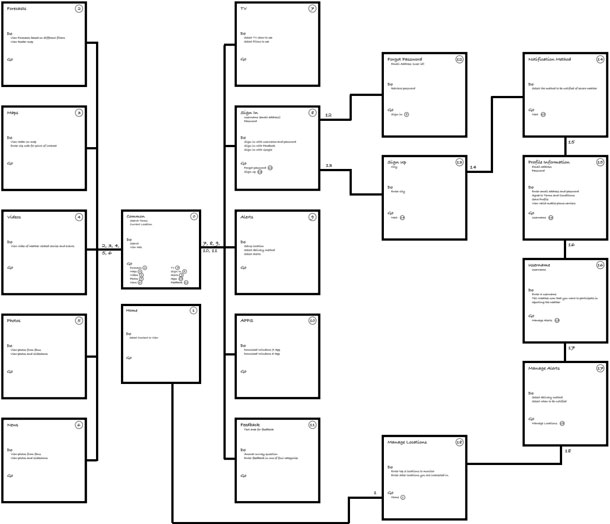
Draw the map by attaching the cards to a whiteboard and draw lines to connect all of the cards referenced in their respective “Go” sections. Cards with a large number of arrows may be candidates for the Common card (Figure 12).
If you consider the information architecture a vital artifact of a system design, consider building and maintaining a DoGo map—it can help keep your system well organized and on track.
DoGo 地图这一轻量级工具可以直观地展示系统信息架构的概览。使用该工具,团队可以快速了解以何种方式将新内容放置在什么位置最合适,确定现有信息架构 (IA)在什么地方 可能令用户感到困惑,并支持用户体验团队与开发团队进行交叉协作。本文提供了关于如何创建 Do-Go 地图的分步骤说明和相应示例,并说明了如何浏览 Do-Go 地图。
DoGo 맵은 시스템 정보 아키텍처의 개관을 시각적으로 대표하는 간단한 툴입니다. 이것은 어떻게, 그리고 어디에 새로운 콘텐츠가 가장 적합한지 실무자들이 이해하고, 기존 정보 아키텍처의 어느 부분이 사용자에게 혼란스러울 수 있을지 찾아내 주며, UX와 개발팀 사이의 교차 협력을 가능하게 해주는 즉각적 방법을 제공합니다. Do-Go 맵 제작에 필요한 단계별 설명, 예시, Do-go 맵 탐색법이 제공됩니다.
Um mapa DoGo é uma ferramenta leve para representar de forma visual uma descrição geral da Arquitetura de Informação de um sistema. Fornece à equipe uma forma rápida de compreender como e onde o novo conteúdo se ajusta melhor, permite identificar onde a arquitetura de informação existente pode serconfusa para o usuário e possibilita a colaboração cruzada entre a equipe de desenvolvimento e a experiência de usuário. As instruções passo a passo para a criação de um mapa Do-Go, exemplos e instruções para navegar no mapa Do-Go são fornecidos.
O artigo completo está disponível somente em inglês.
DoGoマップは、システムの情報アーキテクチャの概要を視覚的に表す軽量のツールである。
これを使用することにより、設計チームは新しいコンテンツをどのように、どこに配置すればよいのかを迅速に判断し、ユーザーにとって現状の情報設計のどこがわかりにくいかを特定することができるため、UXチームと開発チームが互いに協力して設計開発を進めることができるようになる。
Do-Goマップ作成のための手順や作成例、Do-Goマップの活用方法を共有する。
Un mapa DoGo es una herramienta liviana que se utiliza para representar de forma visual una descripción general de la arquitectura de la información de un sistema. Le proporciona al equipo una forma rápida de comprender cómo y cuándo el contenido nuevo se adapta mejor, permite identificar dónde la arquitectura de la información existente puede ser confusa para el usuario, y, además, permite la colaboración cruzada entre los equipos de experiencia de usuario y de desarrollo. Se proporcionan instrucciones paso a paso para crear un mapa Do-Go, indicaciones para navegarlo y ejemplos.
La versión completa de este artículo está sólo disponible en inglés