Like New Year’s resolutions, people’s plans don’t always materialize into actual behavior. Plans to complete Massive Open Online Courses (MOOCs) are a good example. People often enter MOOCs with strong intentions to complete but either drop out mid-course or simply fail to complete all required course activities.
We studied professional development MOOCs for teachers and educational leaders around the globe and found that even educators themselves are not above this self-deception. Near 60% of educators who registered indicated strong intentions to earn a certificate of completion, yet less than 15% actually completed their coursework. These completion rates were very similar to those reported by MOOCs offered by providers such as Coursera and edX intended for broader audiences, despite the fact that many educators needed certificates to meet work requirements.
We wanted to understand this disconnect and ultimately work with MOOC instructors and designers to improve the design of the learning experience. We found that website data analytics complemented self-reports and provided a more complete picture of the user experience—closing the gap between intended and actual use. In addition, thinking about the analytics in a person-centric way preserved the differences between different types of users and revealed patterns that could be used to inform design.
Strong Intentions
MOOC registration forms included a survey gathering information about registrants’ goals, including intentions to complete all aspects of the multi-week course and earn a certificate. We found it was common for over half of the registrants to highly rate intentions to earn a certificate, with an average rating typically between 5 and 6 out of 7. This wasn’t surprising because many registrants needed a certificate of completion to meet work requirements for professional development.
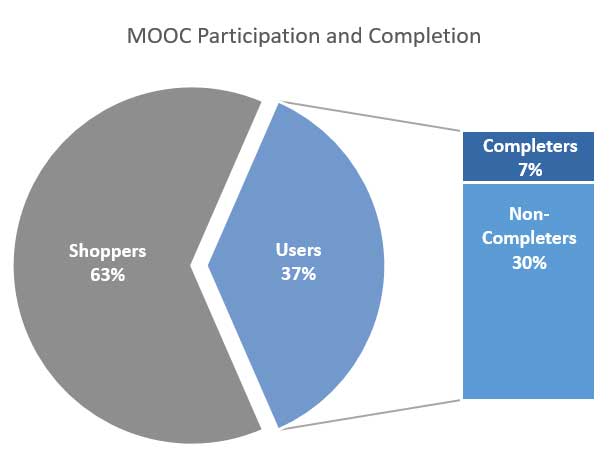
Based on registration, we expected a large amount of online activity and high participation throughout the courses. But despite strong intentions, just over one-third of the participants became regular users, and a smaller fraction actually completed the courses. The majority of participants didn’t even enter their course more than three times. We called these participants “shoppers.” Figure 1 shows these ratios for one of the mathematics education MOOCs.
At some point between registration and the end of the course, learner motivations were changing, even though many participants had a vested interest in completing all of the course activities. However, because we didn’t know when or to what extent this change occurred, we couldn’t start designing effective improvements and interventions to support course completion.
Course Participation
As we dug into the data, the MOOC analytics engine tracked a variety of page views and clicks on course resources. Five key resources best represented participatory engagement in the course:
- Lecture note (text) views
- Lecture video views
- External link views
- Discussion board views
- Discussion board posts
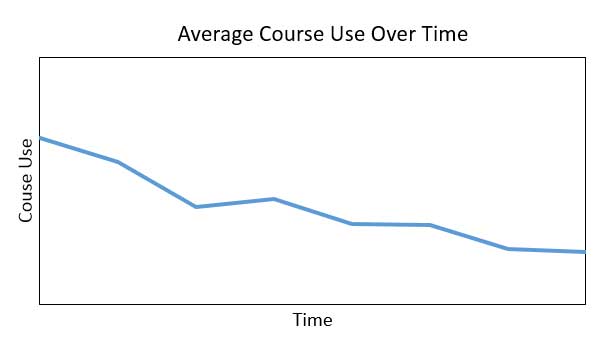
To get a holistic look of users’ participatory engagement over time, we aggregated resource use in each week and plotted the average engagement trajectory through the courses (see Figure 2). This showed that overall, participation decreased through the weeks of the course. However, since we knew some users were completing the course, this overall average trajectory was masking the diversity of actual user experience.
To parse out differences between users, we separated data in the analytics engine by the unique identifier tied to each user’s login information, and we collected engagement trajectories for each individual user. Unfortunately, the individual trajectories were difficult to inspect in such large quantities: imagine a line chart with a thousand lines. This led us to statistically cluster user trajectories using a technique known as latent class growth analysis (LCGA).
LCGA identifies groups of people that have common patterns in a variable, such as course use, over time. Groups are formed such that people within a group are as similar as possible while people in different groups are as different as possible. Thus, the resulting groups are representative of distinct experiences and condense the data into a more manageable form. Many of the leading statistical software packages, such as SAS and Mplus can perform this analysis.
Five distinct groups of users emerged from our MOOC engagement trajectories (see Figure 3), each with a different pattern of use:
- High-stable –High participation throughout the entire course
- Mid-rise – Low initial participation with a rise in the middle of the course
- Mid-decline – Intermediate initial participation with a dip in the middle of the course
- Slow-decline –Iintermediate initial participation with a gradual decline, sometimes leading to late drop-out
- Fast-decline – Intermediate initial participation with a rapid decline, often leading to drop-out in the middle of the course
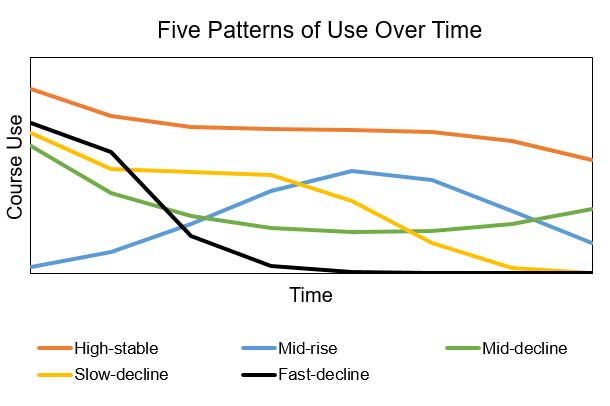
These patterns revealed different experiences in the MOOC. Users were engaging in course resources at different intensities and different rates. Although people in the mid-decline, slow-decline, and fast-decline groups all started the course with similar participation, their engagement trajectories were very different through the course—the latter often resulting in drop-out. Notably, people in the high-stable group were consistently more active than the other groups and were most likely to receive a certificate of completion.
A follow-up survey sent to users with low participation revealed a number of external demands that directed motivation away from the MOOC and resulted in decreased participation. In some cases, unexpected emergencies could not be avoided, such as a family member being diagnosed seriously ill. However, time management was the primary factor in most situations. Many users were prone to prioritizing social, family, and work activities over participation in the MOOC as the course progressed.
At the end of this analysis, we wanted to work with MOOC instructors and designers and find ways to motivate different types of users who had the potential of staying engaged in the course. We wanted to motivate those with low participation to engage more with the course and to motivate those who started with high participation to maintain their engagement with the course.
Design Improvements
Taking different types of users into account, we worked with MOOC instructors and designers to design and implement two course improvements that targeted motivation. These changes recently went live, and initial user feedback from surveys and targeted phone interviews suggests the improvements are working.
First, instructors now send out reminders about certificate requirements periodically throughout courses. This approach appeals most to the mid-rise and mid-decline groups who remain active through the end of the course but tend to fall just short of completing all the course requirements. Early signs indicate users find the reminders helpful. Notably, there is a boost in participation in the final third of courses and more users are on track to completion.
Second, a micro-credential system now awards badges for completing activities within each course (see Figure 4). This approach appeals primarily to the slow-decline and fast-decline groups who are likely to drop out of the course. Micro-credentials provide a sense of accomplishment early on and consistently throughout the course. They also encourage users to engage in the course at an increased level of rigor. Early signs indicate that users like the micro-credential system and its presence also puts more users on track to completion.

These results reinforce the idea that user insights can be converted into tangible informants of effective design. With an understanding of user goals and behavior, we have been able to modify our MOOCs to help users stay on track to accomplish their goals. As we move forward with future improvements to MOOC courses, we will continue increasing the flexibility of our system to accommodate a diverse body of learners.
Lessons Learned
Through our experience studying MOOCs, we have compiled a few lessons learned which are likely to apply to a variety of other domains as well:
- Intentions do not always predict behavior. Intentions have limited reliability, even when people have a vested interest in using a product. Consider complementing intentions to use a product with self-reports of past experiences and observations of product interactions.
- Interaction analytics can be a valuable tool for understanding users. When implemented in a person-centric way, they provide a trace of the user’s experience in a system. This helps identify individual differences and specific pain points, especially when users seem otherwise equivalent.
- Users are shaped by their interactions over time in different ways. Examining the experience for individual users over multiple points in time can be a fruitful exercise. In our case, it revealed distinct user groups that we would have missed with only information about start and finish points aggregated across all users.
- There is a balance between one-size-fits-all and individually personalized solutions. Adaptive systems are highly sought after, particularly in the educational domain. Unfortunately, the cost of design and development is often too high to be practical since users are different in so many ways. A look at patterns of use can reveal groups of users with common tendencies, and focusing on those group profiles can make the number of design challenges much more reasonable.