“Yes, but I want to know if users are delighted,” our client said after reviewing the metrics we suggested for a study to evaluate new gesture-based gaming concepts. After creating a research plan with traditional usability metrics (for example, ease of use and satisfaction), we realized we weren’t hitting the mark.
We knew that there’s more to delight than ease of use. Ultimately, stakeholders want to understand the entire emotional journey of a product. Was some frustration in the middle of an experience suitable if the end result was excitement? With more and more requests from clients to understand the whole story, we started down a path to discover how to incorporate emotions into our research.
Early Explorations: Relying on Moderator Interpretations
Emotions, and the role they play in the user experience, have been in the UX conversation for some time. Biometric analysis was an obvious candidate for understanding emotions, but wasn’t feasible due to clients’ limited timelines and budgets. Price tag aside, we were concerned with the distraction that biometric-related hardware would introduce. We’ve worked hard to create labs that evoke specific settings, such as a living room, a home office, and even an operating room. The emphasis is on the user rather than the recording equipment; intrusive biometrics-related equipment would call attention to the testing mechanisms rather than the topic at hand.
We began by observing participants’ behaviors and noted moments of delight and frustration based on their facial expressions, actions, and verbal cues. We quickly realized this was far too subjective and difficult to standardize. Despite efforts to ensure that moderators would record emotional observations consistently, we encountered a greater range of facial cues, behaviors, and comments than expected. Sometimes assumptions were made by our researchers based on these verbal and non-verbal expressions and the data felt forced. Unsure of how to accurately interpret users’ cues, we began to explore the idea of relying on participants’ self report.
Later Explorations: Turning to Self-Report Emotions
Our initial approach to collecting self-report data involved asking participants the open-ended question of how they were feeling at various points in the experience. However, we observed that many participants struggled to find words to describe their emotions, and the results were difficult to quantify. We explored the idea of providing a standard set of emotions to participants that would aid in reflection and allow for researchers to easily quantify and map the data. Inspired by Robert Plutchik’s wheel of emotions, we created an emotion chart that plotted emotions along one axis and levels of intensity along the other axis (see Figure 1). Each box on the chart corresponded to a number to facilitate quantification.
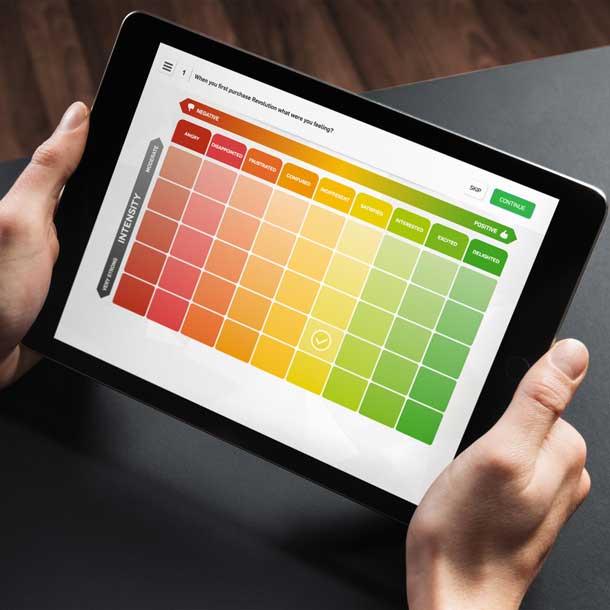
Participants described in their own words how they were feeling at distinct points throughout the session but would also make selections on the emotion chart. The goals for using the chart were to reduce moderator bias, standardize data collection, and take into account emotions along with traditional usability metrics. Our first study that incorporated self-reported emotions confirmed some of our suspicions: high usability scores were not always correlated with positive emotional ratings. Our first analysis told a richer story because we went beyond usability metrics (see Figure 2).
Validating a Self-Report Method
While we remained confident that the self-report approach offered greater insight into user emotions, the big question remained: is this more or less effective than other emotion-capturing methods? As an agile and lean UX company, we were not interested in comparing self-reporting to methods that required major financial or time investments. We wanted to compare this method to existing products being marketed as leading emotion-capturing tools. Since time was of the essence, we were not interested in a longitudinal or quantitative study so we planned a user study with multiple rounds of testing that could be done quickly.
In our first round of validation testing, we showed emotional stimuli video to nine participants. We used the “How are you feeling?” prompt to ask them to report their emotions. We also asked them to self-report using the emotion chart. We sent session video recordings from multiple camera angles to emotion video analytics company Emotient. We also processed audio files through the Moodies Emotion Analytics service. After comparing the outputs, we found significant differences between what the analytics tools reported and what participants reported. We were surprised to find different emotions being reported between two camera angles from the same video clip. The video analysis was also inconclusive for participants who wore a hat or rested their head on their hand. Some participants had to be eliminated from the next round of testing because of these factors.
Second Round of Validation Testing
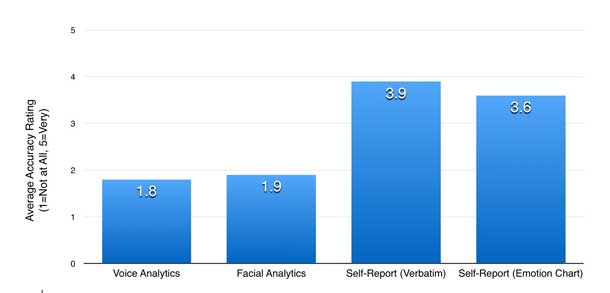
In our second round of validation testing, we asked five of the original nine participants to return one month after their initial sessions. We aggregated and randomized the outputs from the video analytics, voice analytics, self-reported verbal comments, and self-reported emotion chart data. Participants watched videos of themselves watching the emotional stimuli (from the first round of research). Videos were edited into short clips so that participants would not be overwhelmed with information and so they would be unable to hear their comments from the first round of research. We then presented participants with the randomized emotion data and asked them to indicate their level of agreement that the reported emotion represented the emotion they felt during the video clip from the first round of research (see Figure 3).
Example of Participant Data
| Emotion Tracking Tool | Response/Analysis | Level of Agreement by Participant (1=Low, 5=High |
| Facial Analysis (Lab Camera) |
Disgust
Surprise |
1.7 |
| Facial Analysis (Lab Camera) |
Surprise
Neutral Sadness |
1.7 |
| Voice Analysis | Hostile | 1.7 |
| Self Report
(Verbatim Response) |
Interested | 3.3 |
| Self Report
(Emotion Chart) |
Delighted | 4.0 |
Once participants rated how accurately the various emotion data represented how they felt during their initial research session, we analyzed the data and averaged the ratings across all five participants. Every participant rated their self-report emotions (via verbal reports and the emotion chart) as more accurate than the emotions inferred by the analytic tools. The verbal self-reported emotions ranked slightly higher than the emotion chart (see Figure 3). Participants employed a variety of strategies for determining how they had been feeling during the first round of research, but most noted that they simply recalled how they had felt.
While implicit approaches to interpreting emotions were perceived to be less accurate than self-report approaches, there are still challenges to giving participants specific descriptor words. In some cases, participants prefer descriptor words to help them describe how they feel, but in other cases, participants find words to be in the way. In some cases, participants suggested that emotions are so complex that for any given situation, they may feel multiple emotions in any given moment. In response to this, we have incorporated a sliding scale with a thumbs-down on one end of the spectrum, and a thumbs-up on the other (see Figure 4). This has allowed participants to indicate how positively or negatively they feel without having to commit to specific emotion labels.

Emotions are Complex
While the argument can be made that participants do not necessarily understand the complexities of their own emotions and cannot properly express them during a session, our research shows that users are confident when given some parameters for reporting emotion. The reality is that people make choices all the time based on how they interpret their emotions; whether their interpretations are “accurate” or not, they still profoundly affect their decisions.
There’s still a lot left for us to learn in the arena of methods for understanding emotions in UX. Though by no means perfect, the emotion chart has become the most agile, truest method we’ve found for understanding emotions. It enables research participants to quickly and accurately convey how they feel throughout a product experience, and does so in a way that is easy for researchers to quantify and communicate. The end result allows researchers and stakeholders to show a multifaceted emotional journey in a visual and meaningful way through self-reported emotional data.
And that makes us feel excited.
[bluebox]
Applications for Self-Report Emotions
- Usability studies. Collect emotional data in order to analyze how it correlates to ease, satisfaction and likelihood of use.
- Benchmark studies. Compare how emotions affect the experience over time.
- Focus groups. Have participants record their responses independently, allowing the moderator to collect emotion data without group influence.
- Out-of-box studies. Capture how emotions change during initial interactions with a product.
- Diary and longitudinal studies. Have participants record their emotions over a longer period of time in order to paint a compelling picture of the entire emotional journey.
[/bluebox]