Truly understanding the feelings of our users has always been the dream of user experience researchers. Are they enjoying themselves? Are they frustrated? Are they genuinely interested and engaged? Understanding how a user truly feels in reaction to an experience can help us to optimize specific aspects of the experience to exude certain expressive states. We are entering a new age of insight that probes at the core of our users’ experience: studying their emotions.

Failings of Current Methods
UX research often centers on gaining insights directly from participants to understand their experience. However, it is important to recognize that participants (as well as researchers) are not always objective, and fall prey to the weaknesses of the human mind. A common way to address emotional and cognitive aspects in user experience testing today is through a retrospective self-report where users are asked to describe or answer questions about their experience, either verbally or through a written questionnaire. While these methods are commonplace, they rely too heavily on the highly subjective nature of participants’ interpretation and recollection of their emotions. The reality is that participants tell us what they think we want to hear and/or selectively report their emotions. Sometimes they can’t even interpret their own feelings well enough to tell us about them. Physiological measurements remove subjectivity in evaluating user experience by relying on quantitative metrics that are the output of devices that measure primarily involuntary, often subconscious, responses to stimuli.
New Methods for Measuring Emotion
New biometric (as well as neurometric) devices that are practical, reasonably priced, and suitable for UX practitioners, have evoked both enthusiasm and skepticism. I freely admit that I was highly skeptical of seemingly mystical devices that could tell me what my users were feeling, but I was also fascinated by the possibilities. Much of the skepticism is rooted in a lack of knowledge and experience. Presently, little has been published or presented on this topic within the UX community and, to my knowledge, there are few who are currently performing this kind of research. My personal journey with these devices started by applying eye tracking in UX research. Eye tracking provides an objective way to directly understand the user’s eye movement.
Eye Tracking
Eye tracking is a powerful tool for user researchers, and, when properly used, can provide insights unachievable by other research methods. The most obvious, yet nonetheless unique, ability of the eye tracker (Figure 2), is that it can track the location of a participant’s eyes.

Eye tracking is an essential tool that can be combined with any biometric measurement; such measurements are useless unless they are analyzed in the context of what the user is observing. Time-locking eye movement data with these measurements is key to understanding exactly when and what the participant is looking at. While eye tracking is insightful, it can only tell you what the user is looking at, not why.
Getting Into the Heads of Our Users: EEG
In my early investigations of finding suitable devices for measuring emotional responses, I encountered electroencephalography (EEG). EEG measures electrical activity in the brain by placing electrodes along various points along the scalp. The signals obtained from these electrodes are represented by waveforms reflecting voltage variation over time. (Figure 3)

EEG is the most sensitive instrument accessible to UX researchers and offers features including:
- Real-time, millisecond level precision
- Full spectrum of emotions and cognitive activity
- On-the-fly representation of emotions (depending on software used)
More recent EEG models such as the Emotiv headset (Figure 4) are completely wireless via Bluetooth connectivity and use an over-the-counter saline solution to provide conductivity for the electrodes. These headsets can be worn comfortably during a user experience test and minimally interfere with a participant’s natural behaviors. The trend towards less expensive, lighter weight, and totally wireless solutions will make EEG more practical for UX researchers within the next few years.

It is true that correctly interpreting the meaning of EEG waveforms and translating that data into emotional states is extremely complex and likely outside the expertise of a UX researcher. However, analysis tools can process the raw EEG data and produce visualizations that correspond with a standardized set of emotional states, such as engagement, interest, frustration, happiness, or sadness.
Your Skin Reveals a Lot About How You Are Feeling: GSR
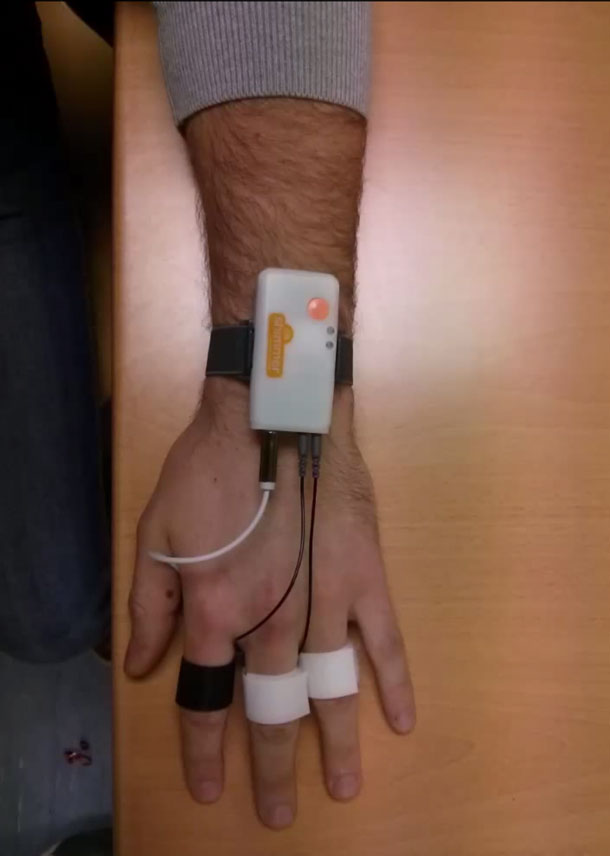
Galvanic skin response (GSR) has long been used to measure physiological arousal. The technology measures the electrical conductivity of the small amount of sweat generated by the pores on your skin. GSR can provide insights into a spectrum of emotional states from being aroused, engaged, or stressed, to feelings of boredom, disinterest, or relaxation. This measurement is ideal for detecting situations where a user is having difficulty using an interface and becoming increasingly frustrated and stressed. These measurements can be evaluated longitudinally to determine emotional trends (for example, periods of increasing or decreasing stress) felt throughout the experience. For applications designed to keep a user actively engaged and/or interested, GSR can help measure the intensity of their engagement, as well as how long it can be sustained. Newer devices such as the Shimmer3 (Figure 5) are far less intrusive and allow for total freedom of movement while interacting with devices. In addition to participant comfort, the device is also fairly stress-free for researchers who want to quickly set up and gather data.
For all biometric measurements, but especially with GSR, it is critical to obtain a baseline measurement prior to the presentation of stimuli. Participants will vary in terms of their typical level of sweat output and their emotional state (for example, feeling anxious) when they arrive at the test facility. Establishing a baseline provides a point of comparison between their state prior to and after a stimulus has been shown. It’s important to know that GSR is incapable of representing a broader set of emotional states such as EEG or facial response analysis, which can both detect levels of valence (positive or negative emotions). For example, GSR would be able to very accurately detect a person’s level of excitement while riding a rollercoaster (as shown in Figure 1). However, it would not be able to detect whether they are having a good experience (or like myself, a terrifying one). EEG and GSR are not for everyone due to the complexity of setup and analysis. Some participants might not be too enthusiastic about wearing something on their heads or having something strapped to their wrists. A far less intrusive (and potentially covert) method for capturing emotions is staring you right in the face.
Let’s Face it, Your Emotions Are Showing: Facial Response Analysis
Facial coding is the systematic analysis of facial expressions. In the 1970s, psychologist Paul Ekman’s early work identified the universality of six core emotions. He is also well known for popularizing a facial action coding system (FACS) that systematically describes facial expressions and movements.

Companies like Affectiva and Emotient have developed new software that can be used to analyze a user’s emotions by examining their facial reactions. Webcams are already used to capture nonverbal behaviors and audio from participants in user experience studies. Using facial analysis is one of the least intrusive methods for capturing emotional reactions in a highly automated manner. These systems use computer algorithms that take video from a common webcam and provide frame-by-frame emotion metrics as outputs. The first step in analyzing the data is to locate the face and then extract the key facial landmarks (represented by green dots in Figure 6) needed to classify each emotional characteristic. The output generated by the software produces an engagement score (Figure 7, top) that signifies whether the user is focused (for instance, “face looking at screen”) on the task at hand. Lower attention values indicate that the user is looking away from the camera—usually an indication of boredom or fatigue (for instance, he or she is “inattentive”). Individual emotions (Figure 7, bottom) are displayed along with the intensity of the emotion being felt by the user.

While facial response is the easiest to collect and analyze relative to the other methods, in my experience it is also the least accurate. Current algorithms are very accurate for highly expressive emotions such as a large smile, but are not consistent for more complex emotions such as contempt. In a UX test the participant’s reactions are often subtly conveyed, such as a slight grin to indicate that they are pleased, or a slight raise of an eyebrow to indicate surprise. The ability to capture these less expressive emotions or varying levels of valence (positive or negative feelings) is critical for user experience research where participants do not always have a strong outward reaction to stimuli.
Why a Mixed Method Is Important
None of the measurements discussed can, by themselves, completely capture the user’s emotional experience. I would consider them to be complementary and, in certain cases, supplementary. The benefit of using multiple types of biometric and neurometric devices is that we can learn different things from different devices. Valence is a measure of the positive or negative nature of the participant’s experience. Using EEG and facial response analysis, we can measure whether the participant is having a relatively good or bad reaction. GSR and heart rate cannot measure valence, but are good indicators of a participant’s level of arousal. When combining the benefits of each type of measurement, we can identify specific types of emotional experiences (Figure 8).
Another benefit of using multiple types of measurements is that we can often use them to validate or invalidate each other. For example, if the facial analysis data strongly indicates that a participant is experiencing high levels of happiness, but the EEG data indicates high levels of anger, one of the measurements is likely reporting incorrect information. At the beginning of this article I discussed the pitfalls of relying on a user’s self-reporting of what they felt. While we can’t completely rely on users to provide this information, it is still critical to ask. Even if the physiological methods were 100 percent accurate (which they are not) we would still be left without an understanding of why users felt the way they did. By using several of these methods together it creates a system of checks and balances to ensure a higher degree of confidence that we are accurately interpreting and understanding the user’s emotions.
Applications for UX Research
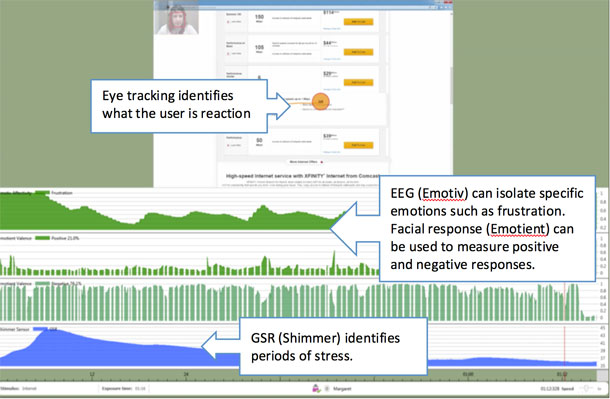
UX researchers and designers can now work to create and refine experiences that are both usable and evoke specific emotional responses. The quality of a user’s experience is no longer limited to whether they can use an interface, but can now include how they feel as they are interacting with it. Let’s say that it’s your job to help your team evaluate the effectiveness of a website’s new product selection process. Under normal circumstances you would likely identify key metrics that would measure the experience, such as task performance, verbal comments, satisfaction scores, etc. However, you realize that this won’t be enough to identify any subtle pain points, and may not help you to know how the user’s emotions impact their decision-making process. By using a combination of eye tracking, EEG, GSR, and facial response analysis (Figure 9) you can pinpoint when certain emotions are being felt.
Key benefits to this approach include: Understanding what attracts & engages attention. Using eye tracking, we can determine:
- What initially attracts attention (for example, pricing, feature comparison, interactive elements, photos, etc.)
- What sustains users’ attention
- What pattern users’ eyes follow as they browse the online store
Understanding emotional engagement. Using EEG, GSR, and facial response analysis we can determine:
- What the moment-by-moment emotional state is during the entire online experience
- Overall valence (positive or negative) reaction via Facial Response
- What excites the user and what they find engaging (GSR)
Using self-report methods conducted post experience we will learn:
- Why users look at certain elements on the website
- Why users feel a certain way when looking at elements
- How users feel at various parts of the shopping experience (such as the homepage, landing pages, product pages, or checkout.)
By understanding the highs and lows of a user’s emotional journey, a team can optimize features of the design to minimize specific pain points and emphasize elements that provided a positive experience.
Challenges for the User Researcher
The benefits of these tools also come with significant challenges for user researchers. All of these tools originate from fields unfamiliar to user researchers, such as human physiology and neurology. These tools can therefore be intimidating and potentially risky for user researchers to adopt. Even with new, more approachable equipment, there are many challenges to tackling this kind of research:
- The need to acquire the necessary technical competence to set up and operate advanced equipment and ensure a rigorous process is in place to collect accurate data.
- Someone on your team needs a neuroscience, cognition, or experimental psychology background (preferably a Ph.D.).
- Physiological studies require higher sample sizes than typical qualitative user research methods.
- Pilot testing is essential to determine if the equipment is properly configured and outputting the expected type of data.
- Equipment must be carefully calibrated with each participant and baseline measurements should be taken to account for variations between individuals.
Another challenge lies in the interpretation of data, since the same kind of physiological responses may be observed for different mental states, such as frustration, surprise, or increased cognitive effort. A correct interpretation requires knowledge of the context in which the data was obtained. To better understand the results, it is therefore advisable to record additional observations along with the physiological measurements, such as comments, observed behaviors, and subjective ratings of events.
The Future of Studying Emotions
Current methods for understanding a user’s emotional response are, at best limited, and, at worst, entirely inaccurate. As the field of user experience evolves, we need to explore new methods for measuring emotional response using technologies borrowed and refined from neuroscience and human biology. There are still significant challenges to implementing these new measurements. However, the current generation of tools is considerably more economical and practical for UX researchers than ever before, and all indications are that this trend will continue over the next several years. I’m convinced that eventually we will reach a point where collecting physiological data that helps us understand our users’ emotions will be commonplace. A brave new world of user experience research that includes physiological responses is on its way. Stay tuned. [bluebox]
Where to Learn More
Intro to Emotion Research
- An Introduction to Consumer Neuroscience & Neuromarketing – Coursera online course covering the basics of applied neuroscience to consumer experience.
Eye Tracking
- Eye Tracking in UX Design – This book provides an overview of eye tracking in UX research and specifically addresses the use of biometrics.
- SMI Eye Tracker + EEG Integration – SMI is currently working to integrate physiological measurements with eye tracking.
EEG
- EmotivEpoc Headset – The Emotiv EEG headset offers the best combination of accuracy and relative unobtrusiveness for participants.
GSR
- Shimmer3 GSR + Optical Pulse – The Shimmer3 unit offers an easy to setup and relatively unobtrusive wireless GSR unit.
Facial Analysis
- Emotient Facial Analysis – SDK available for customization and integration into other applications.
- Affdex Facial Analysis – Standalone web-based service.
Integrated Solutions
- iMotions Platform – iMotion’s Attention Suite provides a platform for data collection and analysis of numerous bio/neurometric measurements
- Noldus Usability Testing Suite – Software for capturing various usability test metrics now including a facial analysis module.
[/bluebox]
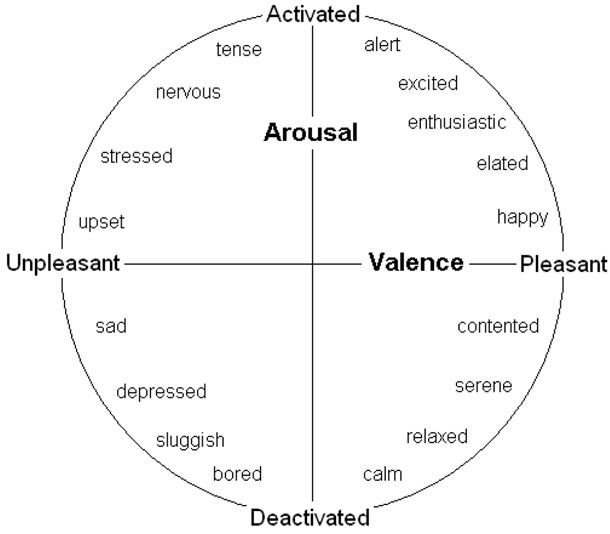
Text of Figure 8: Arousal/Valence model
This diagram shows a list of descriptive words around a circle. The circle is divided by a horizontal line showing valence from unpleasant to pleasant and a vertical line showing arousal from activated to deactivated. Starting from the top of the circle, the four quadrants are:
- Activated and Pleasant
- alert
- excited
- enthusiastic
- elated
- happy
- Deactivated and Pleasant
- contented
- serene
- relaxed
- calm
- Deactivated and Unpleasant
- bored
- sluggish
- depressed
- sad
- Activated and Unpleasant
- upset
- stressed
- nervous
- tense
[/greybox]