I had a rare moment of clarity during the closing keynote speech of the UXPA 2015 Conference last June. Milissa Tarquini of Scripps Networks was telling the audience of some 600 usability professionals that we will never—we can’t ever—be happy.
Milissa explained. All of us UX professionals are born with a particular toxic mix of empathy and tenacity that compels us to fix what no one else will. For a content designer like me working in state government, that means fixing tangled instructions—online or on paper, impermeable web content, and forms and apps that whisper “your chaos has just started my friend.”
“We can’t be happy,” said Milissa. “In order to be empathic, we have to feel the problems…(and) tenacity means that we can’t put them down until we’ve solved them, or at least made them better.”
But how can we really tell if we’ve made anything better, less frustrating, cheaper, or less of a hassle for the people we serve? Maybe more importantly, how do we convince other people that we have?
Here’s one answer: we can measure the effects of our work. Content design is a subjective mix of words and organization over which people can and will always disagree. But it’s harder to argue with data that demonstrates such design has actually changed human behavior. In the private sector, designing and wording information for this purpose is old hat. It’s called marketing.
In government, good content design gets citizens to actually notice and quickly absorb information they have a right to understand, such as what they are voting for, what their benefits are, and what, exactly, they’re required by law to do.
So how do we in government know if we’re really making a difference? Using the power of usability testing, we can redesign content and prove that citizens can read and use it easily, without help. But we can take it a step further.
We can also establish what it means when groups of citizens or businesses or doctors can suddenly understand critical information without help. How much faster or better can they do their jobs? How much faster or better can we? What costs have we all avoided because they didn’t have to wait for help or delay an action? And how does that affect their feeling about their own government?
Here are four examples (three recent, one older) of team projects I’ve helped guide me in my 15 years with the Washington State Department of Labor and Industries. There we believe that all of the user-centered design work—online and off—is making it easier for our customers to do business with us. But these projects happen to have some numbers to show for it, and there should be more to come.
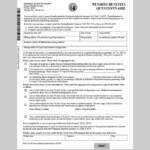
The original form Both questions and required document are on the same page.
The front of the form has the questions, listed with good spacing.
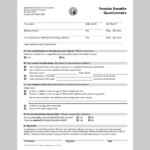
The back of the form has a table with the required documents.
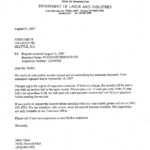
This version simply acknowledged the citizen’s request for public records. (Credit: Washington State Department of Labor and Industries)
The revised letter was shorter and informative. (Credit: Washington State Department of Labor and Industries)

Flyer sent with the letter The flyer explained the process that must take place before the records could be delivered. (Credit: Washington State Department of Labor and Industries)
Pension Benefits Questionnaire revisions
Case Study 1
Form and explanatory cover letter: Workers’ Compensation Pension Program, 2014
Business problem: Workers’ comp pensions taking too long to process.
Background: Some on-the-job injuries are so severe they can permanently disable the worker and make him or her eligible for a workers’ comp pension. In 2014, Washington’s state-run system allowed 1,390 of these pensions, each one calculated and arranged by pension benefits specialists at the WA Dept. of Labor and Industries (L&I).
In 2013, L&I’s pension managers began looking for ways to set up these pensions faster and more efficiently. Their detailed analysis revealed that the process tended to stall whenever required paperwork was expected back from the worker. The delay would sometimes result in an income gap for the worker, who was then hanging between two different benefit systems. A new system of reminder calls to workers helped, but the program managers suspected that clearer, more usable documents would speed up the process even more.
Solution: First step: make the form easier to understand.
A tight timeframe meant benchmark usability testing wasn’t possible, but the team we assembled was made up of staff members who spoke with pensioned workers every day and knew them well. Working together, we simplified the form used in the first phase of the pension process (Figure 1), on which workers are ask to list their beneficiaries, if any. The program quickly launched it as a pilot.
Measure: Within a month, the on-time response rate jumped from 48% to 67%, which later rose to 71% before leveling out to an average 60% on-time rate in the first year. What’s more, the faster paperwork turnaround meant the program was able to reach its long-sought goal of sending 98% of first pension payments out within 70 days of the pension award date, up from 73% before the new documents were launched.
Coming up: The project will soon enter its second phase, in which we will launch clearer material to explain the pension options we can offer the worker (after we’ve collected that earlier paperwork). At some point after the launch, we’ll know by how many days we cut down average processing times, and what that will mean to our customers.
Case Study 2
Form: Workers’ Compensation Claims Program, 2015
Business problem: A form used more than 200,000 times per year was generating high call volumes that took time away from the staff’s ability to process injured worker claims.
Background: Each month, injured workers who receive workers’ comp wage replacement benefits in Washington State must provide a status report by completing, signing, and sending in a form. On it, they indicate whether they’ve returned to work, held other jobs, or received other benefits. In 2013, a program team analyzed the first 100 days of a typical claim and found that the form then known as the Worker Verification Form was generating an unusually high volume of calls from workers who did not know how to fill it out. Time spent on these calls slowed down claims processing.
Solution: A staff team simplified the form, tested it for usability with 10 representative customers, and then simplified it further.
Measure: For a one-month period before the simplified form was launched, agency staff logged all calls related to the form. Post-launch, the staff continued to log calls and found that call volumes had quickly dropped by 89%, from 2,055 to 255 calls per month.
Case Study 3
Audit: Workers’ Comp Audit program, 2013-14
Business problem: Low employer response rates to requests for business records.
Background: In 2014, L&I launched a new effort to ensure that construction company hires were being covered by workers’ comp insurance. For a six month period, L&I’s Desk Audit program sent requests for records to 100 employers referred by the agency’s field investigators. The disappointing 16% response rate, as well as a complaint raised by one of the employers, prompted a look at the clarity and tone of the mailing.
Solution: Working with two agency auditors over the course of several one-to-two hour meetings, we improved the usability of the material using basic user-centered design principles. In this case we:
- Clearly explained the mailing’s purpose in a brief, one-page letter.
- Put specific instructions on a separate, professionally designed information sheet.
- Shifted to a courteous, conversational, and “un-bureaucratic” tone throughout, using the active voice and everyday language.
Measure: Pilot results were logged by an auditor, who found that the clearer mailing generated an increase in on-time response rates from 16% to 41%. A follow-up check showed only a small drop in the rate.
The measure itself was enough to convince the audit program to apply UCD principles to all of the audit documents its uses with approximately 4,000 Washington employers each year. The project is about 50% complete and scheduled for a 2016 launch.
The revision nearly eliminated phone calls, as callers had tended to call about the status of their requests.
Title: Request for Public Records revisions
Case Study 4
Information sharing: L&I Public Records Program, 2009
Business problem: Back in 2008, our state public records program was so flooded with calls from confused customers asking about records that the customers actually slowed deliveries of the very records they were so anxious to receive.
Solution: A six-member staff team worked to develop a clearer letter to acknowledge each public record request. But usability testing revealed the deeper issue: inquiring customers wanted to know what happened after they made their request. They didn’t understand how long it could take to locate a specific record and then redact confidential information. Armed with this finding, we designed an informational insert that explained in plain and conversational language how the process worked (Figure 2).
Measures: Based on before and after staff call logs, call volumes dropped by 95% immediately after the new mailing was launched. Furthermore, the program was able to explain what the dramatic drop in phone calls actually meant to citizens and taxpayers:
- Reduced the average time it took to respond to records requests from 12 to six days.
- Allowed the small staff to handle a 300% increase in demand for records the following year, and cancel an earlier plan to add two staff members which would have cost the program an additional $110,000 per year.
So Why Does All of This Matter?
In the first three case studies, it’s clear our work speeded responses to our information requests. But we hope to take it a step further, as we did in Case Study No. 4, and show the concrete public benefits.
Joseph Kimble, a law professor and major force in the US plain language movement, expressed my next point best almost 16 years ago in the 1996-97 issue of The Scribes of Legal Writing:
“But—and here is the irony—for the very reason that these benefits are so apparent, companies and agencies are not inclined to try to measure them. Why spend more money to study how much money the company was losing and is now saving? Rather, the company knows from experience that a document is causing trouble; somebody revises the document; and if the trouble seems to go away, the company calls it good.”
Fortunately, our current agency director takes the opposite view. He urges performance measures in all of our improvement goals, including the one my work supports: make it easier for customers to do business with us.
All of this matters, of course, because most of our agency’s work is supported by all employers and workers in Washington who pay into the workers’ comp system. It’s a public trust, not a for-profit enterprise. We’re only beginning to learn how many efficiencies and improvements we can pull out of the UCD hat to lower costs, speed service, and avoid alienating the people we serve.
A great deal of our work revolves around asking for information and then using it to make correct decisions about what benefits are allowed, what premiums should be paid, and what charges we can accept. This is why the way we choose to ask for that information, online or on paper, is so important. If we get it right at the beginning, the entire process that follows can be far less complicated.
Objective performance measures are critical precisely because language and design are so subjective. Unlike surgical techniques or actuarial calculations, people have opinions about word choices and writing styles. Not all will be persuaded by research showing there really are some basic UCD techniques that are very likely to produce more usable content and less chaos in their processes.
The more we can come up with clear data showing that, for example, a plainly worded, concise, organized instruction written in a non-threatening tone will actually create a more willing and cooperative customer or citizen, the more our work will be accepted and used routinely.
And that might make us a little happier.
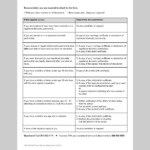
How to Measure UCD Projects
You can use these methods to track issues for your organization and also for the customers you serve. In tracking, use internal data or manual logs to create benchmarks, and then check again after launch.
What to track and what to measure
Potential Issue |
How to track and what to measure |
|
| Too many phone calls on specific document/content | · Log the number and length of phone calls
· Measure increased productivity or faster service times |
|
| Slow customer service | · Measure the time between request and service completion
· Log of service complaints |
|
| Customers are slow to pay | · Count delinquencies, late payment fees, subpoenas
· Measure the time between billing and payment |
|
| Customers are slow to act (for example, too many follow-ups/reminders required to elicit customer/citizen action) | · Compare the date correspondence or billing was sent to the date of response
· Log reasons for lateness (Confusion? Hostility to the message? Not able to pay?) |
|
| Wait times too long for outside authorizations needed to move process forward | · Track the dates correspondence or billing sent, and the date of arrival
· Track timeline of entire process for lag times |
|
| High percentage of decisions litigated | · Look up total numbers on record | |
| Low customer satisfaction, either perceived or measured | · Use on-going customer surveys
· Hold focus groups with customers |
|
| Low employee morale | · Include questions about satisfaction versus frustration or monotony in surveys of employees
· Hold focus groups with employees |
|
| Customer certifications slowed by need for repeat inspections | · Track percentage of inspections that need follow-up and the cost of each follow-up
· Track changes in total inspections completed in a week/month/year |
Calculating Costs
You may be able to roughly calculate the costs associated with many different kinds of problems.
For your organization
- Hourly salary of affected staff multiplied by extra hours required.
(Note: Reducing staff hours spent on fixing customer errors and misunderstandings doesn’t need to suggest job cuts. Plan ahead for how you’ll use that saved time to, for example, serve citizens faster, or add critical services.) - Other extra costs, such as mailing, fuel, overtime, etc.
For your customers:
- Customer’s extra costs, such as interest, penalties, work delays, delayed procedures, certifications, etc.
Watch for Opportunities to Measure
- Look for process improvement initiatives already active in your organization.
Chances are the initiatives are already measuring, and that one of the customer “pain points” they are uncovering is confusing content. - Talk about goals and measures with your revision team before you get started.
Get specific. Program staff members are usually enthusiastic about the prospect of fewer phone calls and customer misunderstandings. Urge them to go deeper. On one recent project, the team realized that our clearer permit application should soon reduce the number of times an inspector has to revisit a site due to unprepared homeowners. Why should we care? Because if a single inspector isn’t continually revisiting sites, he can do more inspections in a given time, which reduces delays for other customers. Plus, we save on gas and the customer saves on reinspection fees. - Before you start, encourage teams to measure.
Explain the benefits of investing staff time in logging/measuring before and after the improvement (for instance, they can prove to management they’ve made a difference). Help staff members make their measuring/logging tools easy to use. - Find out what data your organization/agency already tracks.
If your agency has a research program, find out what they are tracking. A large agency will have a surprising amount of data. And if you’re lucky, your agency may already track customer satisfaction with major surveys on the same subject or program area. - Publicize measurable results when you get positive numbers.
In-house newsletter articles and emails from top managers can help spread the word to other managers in your organization. Interest is often sparked by positive numbers. If the revision team’s effort has paid off with stunning success, consider contacting your organization’s communications office. It might make a “good government” feature story. - Watch for intervening issues that could potentially derail your measures.
Examples:
- Simultaneous process improvement could render your measures inconclusive (for instance, is it the clearer language on the invoice or the higher fee we’re now charging for late payments?)
- Program may suddenly change the way data is collected or saved.
- Program’s management (and your team’s priorities) could suddenly change.
- Sudden change in the economy could throw you off (for example, an effort to speed customer late payments launched during a financial crisis).