Recently, I worked with a health insurance company to build a custom solution for care managers. Our key stakeholder (product owner) at the company had a nursing background and was excited to work with us to build a solution for the nurses in her organization. Often, a product owner will have a vision for what she wants to build and convey this vision to the team. In this case, our product owner was unsure about what solutions she thought would work, so we brought industry tools to help clarify and communicate her vision.
Two of these tools are user research and story mapping. We interviewed and conducted contextual inquiry with more than 30 people involved with the organization’s Care Management process. Findings from this research and other sources were referenced during the first story mapping session with our product owner (PO). As the story mapping session progressed, it became apparent that the findings from the research did not align with the product owner’s vision. It seemed that the PO had been out of clinical practice for too long to really understand the work process currently in use, and she had a hard time considering possibilities outside of the system she was familiar with.
For example, the official Care Management Process called for a medication review to be conducted using one of two different templates. Our research found that the Care Management Team had developed a more efficient third template. The PO insisted that we ignore this third template, referencing company policy rather than embracing the change and supporting the users.
In order to facilitate conversations with the PO on the value of the user’s perspective on the templates and many other features in the application, we quantified the research behind the stories on the story map. This led us to what we call evidence-based story mapping.
Story Mapping
Jeff Patton first introduced the story mapping technique in his 2005 Sticky Minds article, “It’s All in How You Slice It.” Then, in 2014 he published an entire book on the topic titled User Story Mapping. (For more information on story mapping, check out Patton’s book.)
When an Agile team begins to create a list of requirements for a project, these requirements are tracked as “stories.” A high-level story, sometimes called an “epic,” is often broken into smaller stories. These smaller stories describe aspects of a feature that a developer can implement in five days or less. It’s easy to imagine how the number of stories grows very quickly and becomes difficult to manage when kept in a list. A story map creates a two-dimensional view of the list of stories by organizing the epic stories sequentially from right to left, and the detailed stories from top to bottom. This view enables the team to understand all of the stories in context rather than viewing a requirement in isolation.
While a lot has been written about story mapping, Patton simplifies the technique into five steps.
1. Write out your story one step at a time
Consider as an example that we want to develop a mobile application for patients of a dental hygienist. After a bit of research we understand that patients would like to schedule appointments without calling the office, complete insurance and consent forms on the app, and see any notes that the hygienist makes regarding their teeth.
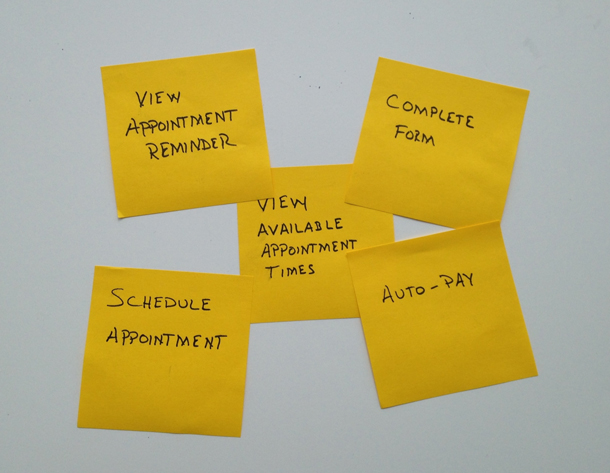
Think of the user interaction with your system as a narrative. What are the tasks that make up that story? Write these tasks down on sticky notes or 3×5 cards.
When we consider the tasks that make up the patient’s story, we would come up with tasks and write them on sticky notes, as shown in Figure 1. This list could include:
- Patient schedules an appointment
- Patient views appointment reminder
- Patient completes consent forms
2. Organize your story
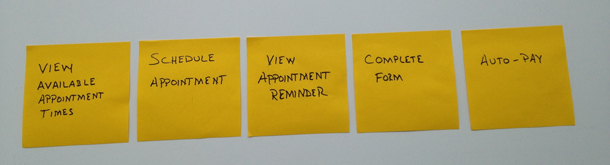
Once tasks have been identified, organize them from left to right in the order in which you would tell the story. This is called the narrative flow. This view of the stories gives you a context to explore details of the tasks.
The initial story map for our hygienist patient app would order the identified tasks following the patient flow, as shown in Figure 2.
3. Explore alternative stories
Continuing with the hygienist story, we can consider different scenarios. Can the patient schedule an appointment on the web or does it have to be done on the app? What if the hygienist is running late or the office has to reschedule the appointment?
All of the details, options, and exceptions can fill in the rest of the map. It is important to note that the map will change as it is filled in. You will likely discover tasks that you hadn’t considered during the initial creation of the map. This is to be expected. It is important to maintain the flow of the story, but don’t get too hung up on the order. If you wonder about the order of two stories, make a quick decision and move on.
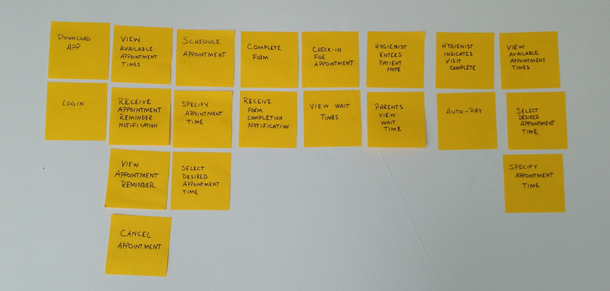
Figure 3 shows how the story map of our hygienist patient app has grown as the details
were added. At this point we really begin to think of everything that is part of the user’s story when things go correctly, and when things don’t go so well.
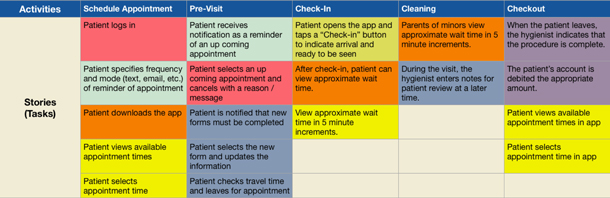
4. Distill your map to make a backbone
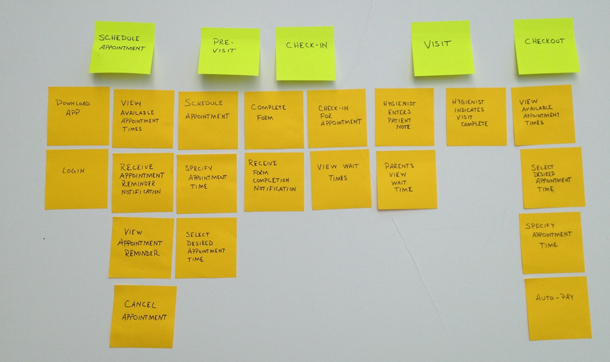
Once you have explored all the details of the story, similar or related tasks can be organized into activities. These activities are often directed at a common goal and help us think of high-level features the app would provide.
Once we organize the tasks in our hygienist app, we identify five high-level activities that the app could support:
- Schedule an appointment
- Pre-visit
- Check in
- Cleaning
- Check out
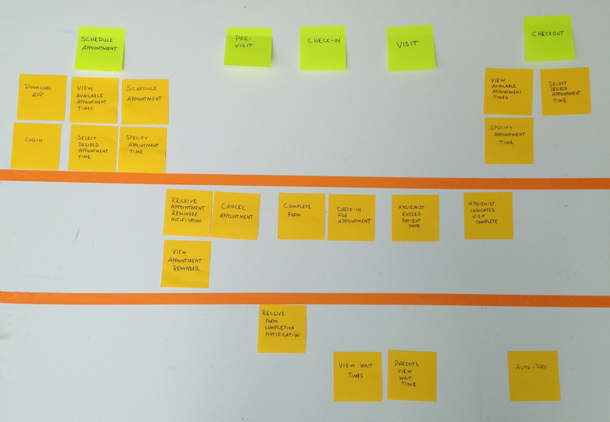
The tasks and high-level activities form what Patton calls the backbone of the story map. The backbone of the patient mobile app is shown in Figure 4.
5. Slice out tasks that help you reach a specific outcome
With a detailed map and an understanding of which activities comprise the essence of the system, we can prioritize the tasks and guide what the team should deliver first. On a functional team the tasks are sorted and grouped to support the delivery of a specific outcome. Ideally, the team would agree on what is absolutely necessary, and these tasks would sort to the top of the map.
The rest of the tasks are sorted below the necessary ones in order of criticality. The less critical tasks are then sorted and grouped by outcome and each group ordered from top to bottom on the map in the order in which a specific outcome could be delivered.
Figure 5 shows the completed story map for the dental hygienist mobile app with the slices indicating the potential delivery outcome. In this example, the nine most critical tasks have been sorted to the top. The next seven tasks are grouped into a specific outcome followed by the last four tasks. Each potential outcome is clearly marked with an orange piece of tape.
Evidence-based Story Mapping
By providing a body of evidence to the team regarding a set of stories, prioritization decisions can become less reliant on gut feelings and unsupported opinions, and less susceptible to the influence of management alone.
To begin tracking evidence, create a spreadsheet of the activities and stories identified on your story map. The priorities may not be quite right, but that is okay because the evidence from the research will reveal the priorities. These evidence-based priorities can then be used to guide further decision-making.
To illustrate this step, consider the simple story map for our mobile app for dental hygienist patients. Each activity and task are entered into the spreadsheet as shown in Figure 6.

This spreadsheet provides the initial structure for gathering evidence. As new sources of information are identified, they are tracked with the specific tasks in the story map spreadsheet.
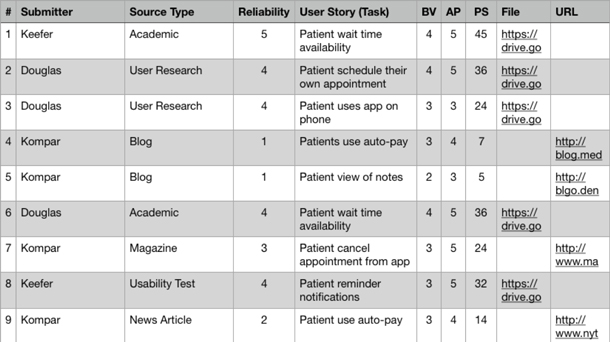
Each information source is assigned a priority score. The goal is to quantify the source in order to quickly understand the value contribution of the source during the decision-making process. The average of all of the priority scores for a specific task in the story map provides a prioritization value.
The values tracked for each source in the spreadsheet include:
Submitter: The person who submitted the source. This is the team member who found the information or performed the user research referenced by the source.
Source Type: Sources to support the stories come from many different places including users (through interviews, contextual inquiry, surveys), business sponsors (through workflow analysis, surveys, and more), usability tests, and other information pools (blogs, magazine articles, books).
Source Reliability: Each source is given a numerical score (from 1 to 5) based on the confidence of the information provided in the source and the story in which it is being used. For example, a usability test that only included two participants would score lower than a usability test with 10 participants. This indicates that the submitter is more confident in the findings of the usability study than the contextual inquiry.
Task: The task from the story map that the research supports. In Google Docs or MS Excel this is a direct reference to the cell in the spreadsheet.
Business Value: Specify on a scale of 1 to 5 the business value of the related task based on the information from the source.
The business value for any one task is relative to the remaining tasks in the map. For example, patients will find much more value in the ability to schedule an appointment from an app than simply receiving appointment reminders or marketing material. The value to the business for patients to schedule their own appointments is reduced workload on the staff and improved service to patients. So, in this case, the schedule appointment task may be given a value of 5, whereas the reminder is given a value of 3.
Appeal: Specify on a scale of 1 to 5, the appeal of the related task to the user based on the information from the source. This score could include observations of frequency of use, duration of task, or level of effort to complete the task.
For innovative improvements to a system, a user may not fully understand the appeal of a feature. For example, a patient’s parent may intuitively like the idea of knowing the wait time for their child’s visit to complete. However, there is a body of research that attributes reduced levels of anxiety when a person knows how long a task will take. This research could provide a source with an appeal score greater than even the users may provide.
Priority Score: This value quantifies the potential priority of the related task based on the other measures. By adding the Business Value and Appeal together and multiplying by the Source Reliability score, the importance of the task (for instance, Business Value and Appeal) is scaled by the reliability of the source. As Priority Score increases, so does the confidence that the task should be prioritized higher. A simple calculation of the Priority Score could be (Business Value + Appeal) * Source Reliability. In this case the Priority Score would range between 0 and 50 ((5+5)*5). [Note: This formula is very simple, but does place a lot of weight on the source reliability. Consider this an easy working example.]
File/Link: A link or the file associated with the research. For website references, we stored the URL. Our research findings and other supporting documents stored on our server were given a location.
Figure 7 shows an example of the sources tracked for the dental hygienist mobile app.
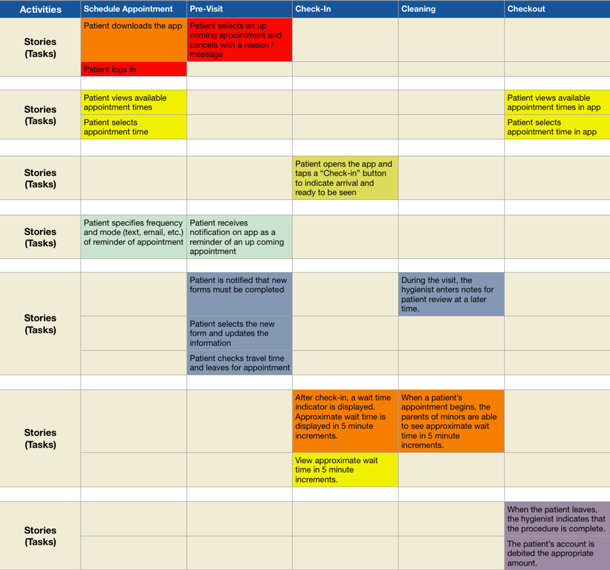
As the evidence for each task is entered, and the average Priority Score for each story is calculated, an evidence-based heat map is created. This heat map, as shown in Figure 8, makes it easy to identify which stories should be considered before others.
The values for the heat map are shown below.

The heat map provides a nice overview of all of the stories for which research has been documented. It can provide input into conversations with the team during prioritization and slicing of the map. Typically, the hottest items go to the top and cooler items go to the bottom. A caution here is that this is based on research and does not include input from the developers. Once the developers weigh in on the time and effort required for each story, the hottest items may not be at the top.
Using the dental hygienist mobile app as an example, the stories for displaying wait time to a patient require much more work from the developers than other stories. So, while these stories are important, they are prioritized lower in order to give the developers room to deliver other value before diving into the more difficult features.
Conclusion
Story mapping is incredibly useful, and ideally the whole project team can work well together with mutual respect. Often, a healthy team can come to consensus on prioritization without all the work that goes into gathering evidence to support a product direction. Unfortunately, story mapping is subject to the dynamics of the real world in which team members have a hard time understanding the story map from different perspectives.
Similar to the proverbial seven blind monks who all thought they were touching something different when they were all touching a different part of an elephant, team members can understand and value the story map with diverse viewpoints. Evidence-based story mapping is one way to clear some of the fog around stakeholder opinions and bring some objectivity to the prioritization step in story mapping. This approach enables the team to agree on metrics that will inform prioritization decisions, and making decisions in a more informed way is never a bad thing.