Some products have it all when it comes to big data insights to user experience. Omniscient smartphone apps draw from geolocation information, contact lists, and cameras. Massive e-commerce sites maintain registered users and transactional purchase data. Business websites operating in unregulated industries and countries set browser cookies and collect telemetry data to no end. In those environments, the signals that user experience designers can leverage to create navigation and structure are nearly limitless.
Where does that leave the designer working with a more limited product? Without fancy smartphone apps, shopping cart items, and session cookies, some UXers might be inclined to stop at traditional navigation menus and static information architectures.
But what happens then when you’re tasked with improving content findability for an existing website or app that’s using good old browsing and searching? You re-examine some of the inputs to the design process; your personas remain validated and unchanged. You’ve facilitated more card sorts than a blackjack dealer and the cards are still lining up. It seems that your information architecture and navigation menus are ticking all the boxes in usability testing—so what to do?
This article will examine the opportunities for data-driven navigation design without the dependency on physical device sensors or cookies, and without building out the intricacies of an elaborate recommendation engine. Leveraging even traditional analytics and usage metrics alone can go a long way in differentiating the content locating experience on conventional websites.
Getting Started
Browsing and searching to access information on the web have been around for a long time. Any user experience designer worth his or her chops is including browsing and searching as a primary navigation tool for their users’ content locating experience. Whether through mousing over hierarchical menus or drilling down through a taxonomy tree, browsing and searching has reliably established itself as one of the most fundamental interactions that visitors rely on for looking up information on websites and applications alike.
In 2017, however, with the pervasiveness of analytics-backed website implementations, advertising, and user behavior metrics, suddenly the UX designer has new navigation opportunities at his disposal. Instead of being constrained to static navigation menus that can take weeks or months to baseline (only to be locked down until stakeholders are willing to commit to subsequent rounds of card sorting), designers should consider leveraging big data to create a dynamic navigation experience—a model that’s intelligently and automatically informed by user behavior. After all, to ignore the data when it’s being collected on the fly risks creating an experience that’s barely more intelligent than thumbing through a paper phonebook.
Putting Big Data to Work
In the midst of a website redesign project, a UX designer comes to a point where they’re probably feeling pretty good about the progress they’ve made. The content has been modeled. Cards have been sorted. Information architectures have been defined. Prematurely satisfied with their navigation model, too many UXers might stop there in thinking about how to best connect users with the content they’re after.
Enter big data and analytics.
Knowing that your site is already passively collecting information about most-clicked pages, pages clicked by peers, and pages that the user has already visited, start thinking about ways to intelligently anticipate the type of content that your users are trying to reach.
When designing portals and landing pages, shape your designs around how your users might be most inclined to visit a page they wouldn’t have otherwise accessed through traditional static navigation. Consider these questions that visitors might ponder when sizing up whether they might want to visit a page:
What pages are most other people looking at?
Depending on the size of your site and the scope of content, there’s a good chance that if something is popular for a lot of people, then it will likely be popular for the next user, too.
Don’t take my word for it though—check your site analytics. Invoking the tried and true 80/20 rule, you’ll probably find that a very small percentage of pages are ever actually visited (or to put it cynically, most content might be crap—a problem that could be solved through governance—but often out of the UX designer’s hands).
So why not play the odds? Rather than throwing a user into a hierarchical navigation portal alone, offer links to pages that have been more popular over some period of time. Anticipate the likelihood that in a sea of content with thousands of pieces (as well-positioned in the IA as they may be), that there is only a small number of pages that visitors keep coming back to.
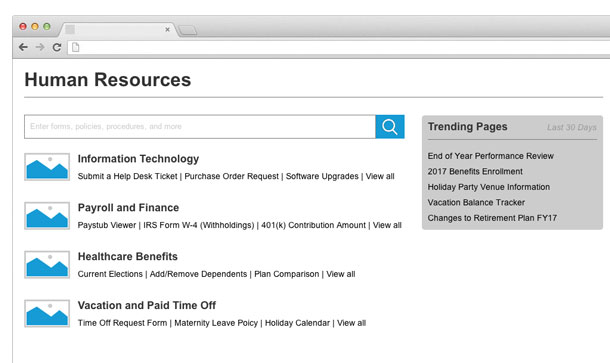
Imagine the usefulness in the context of seasonal content. On an intranet website, for example, end-of-year might signal performance reviews or holiday party planning. Rather than force users to navigate through the hierarchy of pages categorizing myriad human resources-related topics, surface that performance review form or holiday party flyer automatically based on popularity over the past 30 days (see Figure 1).
I’m special; what are people like me looking at?
For sites and applications that serve a diverse range of personas, the “trending among everyone else” approach might be too broad of a stroke. Specialized roles (especially present in enterprise applications and intranet websites) may need a more tailored navigation experience that focuses on data identified by some common characteristic or function.
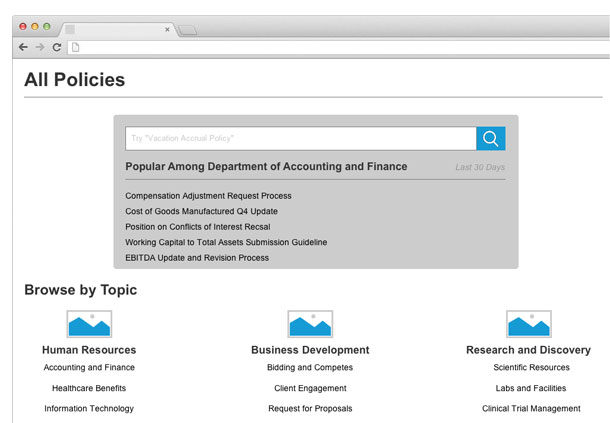
As the designer, understand the unique content needs for each of your personas and include tailored navigation groupings for those roles alone. For example, in the context of the aforementioned intranet website, the staff who uses the site probably spans a wide range of operational and supporting functions. Are the staff in the marketing department likely to be interested in the same forms or policy documents as the finance and accounting people? You’ll probably find that while marketing and finance teams both access the same types of content (like policies and forms), the specific instances of content they use are vastly different. When leaning on big data to meet those needs, segment your analytics-driven groupings based on the role (or at least department) associated with that content, rather than what’s popular across the entire enterprise (see Figure 2).
What did I look at last time I was here?
Depending on the behaviors defined by your personas, your site’s users may very well be repeat visitors. In those cases of return visits, they’re probably accessing the same or similar pages repeatedly.
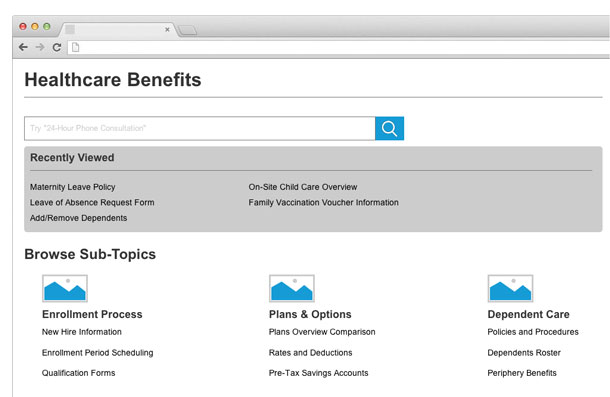
The usefulness of this design depends on the likelihood of new versions or revisions to existing content. Visitors inquiring about complex, long-term life situations—perhaps healthcare benefits for the birth of a new child—may return to pages related to specific childcare benefits policies and options over and over again as they plan their benefits enrollment strategy over time. Even without access to a personalization feature, a designer can leverage individual user analytics to offer navigation directly to the pages that were visited last time the user was on the site (see Figure 3).
What pages or content are related to what I’m already looking at?
A well-structured information architecture neatly places distinct content in separate buckets, but don’t forget to leverage your taxonomy (in conjunction with analytics) to suggest disparate content that both pertains to the same topic and is popular—even if the content “lives” in a different part of the website.
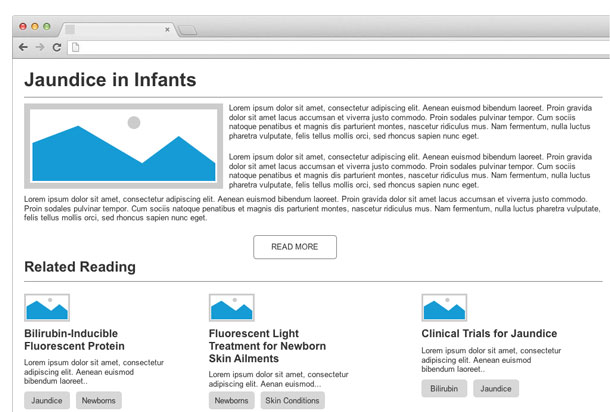
Imagine the experience of looking into treatment options for a family member recently diagnosed with a chronic illness. This user may be in a state of duress and is a high “flight risk” to bounce to another health information website if her questions aren’t answered immediately. She finds your health website, along with the encyclopedic information about the condition needing treatment. But your health website is more than just encyclopedic information. Sure, the bulk of the core treatment content lives in the health topics section, but the information architect has intricately placed other potentially relevant insights like clinical trials, news, and scientific studies on other parts of the site. Thanks to the well-implemented taxonomy, all those related pieces of content—centered around the taxonomy term associated with the illness or condition—can be surfaced by the designer on the same page (see Figure 4).
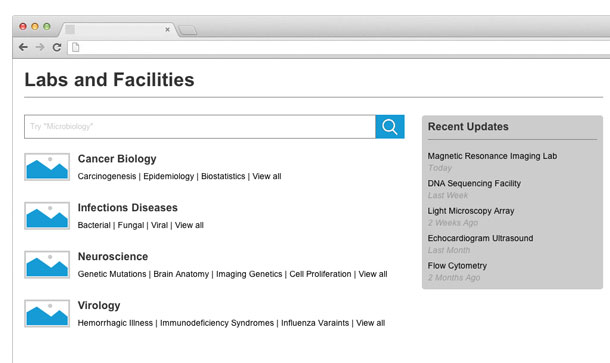
What’s new since last time I visited?
While not so sophisticated but still technically data-driven, your visitors may be looking for new versions of the same content they’ve looked at previously. Publish dates are probably already being captured by your site’s back-end or content management system, so think how visitors could make use of pages grouped by recent updates directly on your categorized landing pages and portals.
If you’re working with personas who approach the site with a “I only care if something’s been added or changed” attitude, then providing navigation options directly to recently updated content may save them a few moments. Users who identify as the scientific research community for example may need to gain access to evidence reviews and practice guidelines on some regularly recurring basis, but may only care to do so if a new version has been published. While ideally this user would interact with a subscription system, not all designers will have access to environments that can support that kind of functionality. Instead, lean on already-available metadata about your content to make intelligent suggestions on landing pages about documents that have changed over some recent period of time—a duration that makes sense for the audience (see Figure 5).
Combining these techniques with active signal gathering begins to cross into the realm of what’s known as a Recommendation Engine, especially in the context of e-commerce sites. While not in scope of this article, consider leaning on established “recommender” frameworks like Google Cloud API or Amazon Machine Learning to take advantage of some of the most powerful out-of-the-box tools in the industry.
Considerations in the Broader Design Process
While data-driven navigation techniques are powerful tools for enabling personalized discovery experiences, they are still very much dependent on the fundamental design processes of information architecture design and taxonomy planning—not to mention a well-integrated project team that’s involved in your design process along the way. We won’t cover the details of each of those activities here, but we’ll at least look at why their dependency to data-driven navigation exists.
Information Architecture
Long before you start exploring opportunities to surface navigation suggestions based on big data, you’ll still have the task of defining your site’s basic information architecture. Solidifying content placement in your site’s hierarchy is needed to inform where and when it makes sense to surface data-driven navigation techniques. In the browse-for-content model, to surface complementary peer-trending content is probably only useful at lower level depths of the site hierarchy. For example, on a retail website, to begin browsing at a category level as broad as, say, shoes, is probably too soon to start offering navigation to trending footwear models. After all, the visitor hasn’t yet browsed to the level navigation that would distinguish between cross-trainers, dress shoes, or boots—let alone men’s or women’s. At this position in the hierarchy, data-driven suggestions for specific products aren’t going to be of much use. Instead, focus your UX efforts on prioritizing the most desired second-level categories, then introduce data-driven techniques at a lower level.
Taxonomy Planning
Defining your site’s taxonomy is critical for making informed suggestions about related content-based navigation. Sure, you could draw a box on a wireframe labeled “related content,” but how would you describe to someone what exactly makes any of the items contained within genuinely “related”? This is where taxonomy comes into play. Imagine you’re designing a product page for a child’s mountain bike. You want visitors to discover related products, but for that to work, your bicycle must be identified in such a way that related products can be suggested. In the context of say, a mountain bike, the product is going to need characteristics of the bicycle like classification (all-terrain) and age (adult). This information tells our theoretical related content box that we can make suggestions for similar products like off-road tires (derived from the all-terrain classification) and other adult-sized bicycles (derived from the age classification). Likewise, it keeps out bad suggestions for this visitor, like road bikes and children’s training wheels.
Communication Is Key
Introduce the opportunities offered by these alternative navigation techniques to development teams and stakeholders as early as possible on your project. While very powerful for enhancing the user experience, data-driven navigation is often very dependent on analytic capabilities that may not be offered natively by your development team’s out-of-the-box platform. They’ll need time to research and identify a technical solution, and as is often the case with a third-party tool, may require stakeholders to pony up for additional costs, even when your designs aren’t dependent on elaborate session data or hardware sensors.
Remember that internally communicating your high-level navigation strategy early and often benefits you as the designer, too. Imagine the potential frustration in absence of careful planning with your team. You go through the effort of drafting high-fidelity wireframes that contain ground-breaking navigation features (ground-breaking for your organization, at least), and then move on to usability testing and find that your designs are more well-received than any other navigation model previously tested with this website. Finally, you confidently present your findings and learn that the only navigation you’ll be doing is through a minefield of technical feasibility and funding roadblocks, effectively reducing the likelihood that your model will ever be implemented.
Don’t Forget About Browsing and Searching
While these big data-backed techniques have myriad practical applications, understand that in some contexts they might not be appropriate at all. Consider the case of an intranet website composed of policies, forms, organizational news, and a staff directory. Leveraging analytics to make navigation suggestions for the types of policy and form content that we’ve discussed might prove very useful in lieu of browsing an exhaustive catalog alphabetically. In the case of the staff directory section, however, to add that kind of trending navigation technique would only introduce cognitive load to the experience of locating an individual alphabetically by last name. (In this author’s personal usability testing experience, for example, while at first glance participants find an analytics-driven portal for a staff directory attractive, the actual task of locating a specific person performed poorly).
Big data undoubtedly opens the door to exciting new models for connecting users with information. It’s important to emphasize that even with access to analytics-driven navigation techniques, traditional browsing and searching shouldn’t be left by the wayside. Analytics-driven navigation is best used as a complement to traditional techniques, rather than a complete replacement.