What does it mean to talk to a government? How can we ensure that we’re being heard? In our own words? With our consent? In an era of Big Data and passive data collection, governments have access to an unprecedented level of information about citizens, yet for many municipalities there is a fundamental disconnect between the services provided by local government and the needs, desires, and priorities of residents.
The typical town hall model for civic participation is broken, seen as both a chore by many public servants and a dead end by community members who may not have the ability to attend pivotal meetings. Other current solutions for government participation, such as 311 government service phone lines and Participatory Budgeting, result in piecemeal identification of problems like filling in potholes or fixing a broken traffic light. They aren’t designed to empower citizens to identify and solve system-level problems in their own communities.
Currently there is not a feasible method for collecting, sorting, and analyzing data in which residents have conveyed their diverse experiences, unprompted by political agendas. The current standard methodologies, polling and surveys, can be biased or too narrowly focused. A rich understanding of the quality of life of a city is often only accessible to ethnographers or those with deep personal and professional ties to the community. Conversely, digital tools in the open data and civic tech fields often rely on whatever civic data has been made available (and machine-readable) regardless of the needs that data serves.
I am passionate about improving the policies that shape our communities, and I firmly believe that user-centered design practices are a necessary element to civic innovation. Furthermore, I believe in the power of data, and I’ve been sorely frustrated by its notable lack in the design community. So I sought to demonstrate that design research cannot only improve civic practices, but can guide us to create data that tells the story of a community through the eyes of its residents.
Combining Data to Create Insight
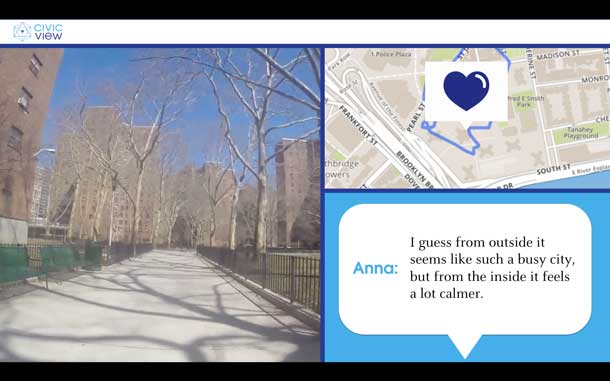
Civic View is an experimental research method and data analysis tool for policy makers and civic innovators. Design researchers working with community residents guide a researcher through their neighborhood. Residents have control over shooting video footage, and they also volunteer to have their emotional state-of-being read through biometric sensors. Altogether the tool incorporates video, text transcription, GPS tracking, and anxiety levels. These various types of data work together to create a robust context that no one data set could deliver on its own.
On the left half of the Civic View tool, there is video of the participant’s environment captured by the participant. On the right side, the top half of the screen shows a map tracking the GPS location of the participant, along with a display of their biometric data at that location. On the bottom half of the right side, there is a display of the participant’s interview, showing what the were saying at the time. All of the data is linked through a time stamp so the researcher can see what the participant is seeing, feeling, and saying, all at the same time. (See Figure 1).
Civic View is an ongoing experiment started during my graduate program in Interaction Design at the School of Visual Arts, and something I continue to refine. In its current phase, the Civic View system includes a comprehensive design research method for collecting data, a custom Javascript library and working prototype, and a functional data set for demonstration purposes. To develop demonstration data, I worked with Anna, a young female resident of a New York City Housing Authority (NYCHA) building to explore her neighborhood in Lower Manhattan. I found areas near the waterfront that she avoided and appeared to cause her anxiety. She discussed her interest in gardening and described a lack of connection to her Tenants Association, the main communication channel she has with local government. With more interviews, one can see how NYCHA could reassess how it interacts with tenants and the specific community resources it provides at each development.
Putting the Pieces Together
Understanding experience is the core of Civic View. That means getting out in the neighborhood and talking to the folks who can best answer your questions. But have you ever heard the phrase, “garbage in; garbage out”? It means that no matter how great your technology, if you are working with bad data, you’ll get bad results.
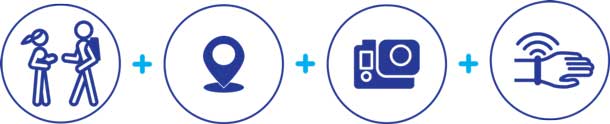
To get good data, you need good data collection. This is why design research is a key component of the system. Over the course of a year, I experimented with various ways to better understand how people experience public space, culminating in this methodology for collecting meaningful qualitative and biometric data (see Figure 2).
The process starts with a basic design research method called the Walkabout. A researcher pairs up with a participant as they traverse their neighborhood and describe their experiences.
While working with the participant, the researcher will be capturing several streams of data, all of which are tied to time.
Data Stream 1: Biometric Data
It’s not always easy to express how we feel. We may not even know when we’re having an unconscious stress reaction to a situation. This is where biometric data comes in; taking a reading of someone’s heart rate or the moisture produced on their skin can reveal emotions they may not otherwise be able to articulate. By including these participant readings in the Civic View system, we can get a clearer sense of the effect of an area on participants, such as whether an open grassy field contributes to a sense of calm, or whether it creates anxiety.
Biometric data also helps the researcher to better interpret qualitative information, such as the interview text. By comparing anxiety levels to what a participant says, we can see where the interview process might have failed to reveal the authentic experience of the participant. This information helps the researcher create a stronger set of follow-up questions for the same participant, or a more informed iteration of the interview itself.
When working with participants, it’s important to remind them that the Civic View method is entirely opt-in. Biometric data can feel emotionally invasive, so it’s a good practice to explain the extent of the kind of data you’re capturing and ensure they consent to the process.

For this aspect of the data collection there are a few options out there, including consumer-friendly heart rate monitors. Civic View makes use of the BITalino system (see Figure 3); it’s affordable and offers the ability to choose from one of three types of biological data:
- Electrocardiography (ECG): A measure of the electrical activity of the heart
- Electrodermal activity (EDA): A measure of electrical conductance of the skin
- Electromyography (EMG): A measure of the electrical activity of muscles
In particular, I found that EDA often helped to explain or validate what a participant would say during the interview. EDA measures the autonomic system, also known as fight-or-flight.
After analysis, the biometric data is shown in the online viewer as a heart-shaped GIF that beats fast or slow. The data is also connected to the participant’s GPS location.
Data Stream 2: Video
Video provides a window into the actual environment of the participant. When we think about place-based data, we’re often thinking about maps. While maps are incredibly important, they’re not descriptive enough. It’s hard to imagine the feel of a neighborhood from an overhead view.
However, there are drawbacks to using video in research. Namely, there are very few ways to summarize the content, and video analysis takes time and human resources. Our method takes this into account and aims to automate this process whenever possible. The following two steps support the researcher in being able to directly see how participants are interacting with their environment:
- Have the participant hold a GoPro camera
- Transcribe the audio using a service like Mechanical Turks
Having the participant hold a camera frees up the researcher to observe, ask questions, and direct the walkabout. More importantly, the set-up grants the participant agency over the research session. Rather than being filmed by the researcher, the participant is in control of what is being recorded. Inherently, this creates a sense of collaboration for the walkabout session. Participants will also tend to focus the video on aspects of their environment they are paying attention to. This gives the researcher a sense of what is important to the participant without having to consistently ask him or her to articulate it.
Data Stream 3: Interview Data
Qualitative data is captured by listening to the stories and experiences that participants share as they walk through their communities. Civic View originally had two different ways to capture qualitative data. The first method was illustrative mapping (see Figure 4), which was later abandoned in favor of an interview process and audio transcription.
Illustrative Mapping
Sometimes it’s easier to draw a story then say it aloud. Early in my research I had participants draw out their experiences on a map of the area, using visual and written language to describe how they feel. However, not everyone is experienced at transposing their thoughts onto a map.
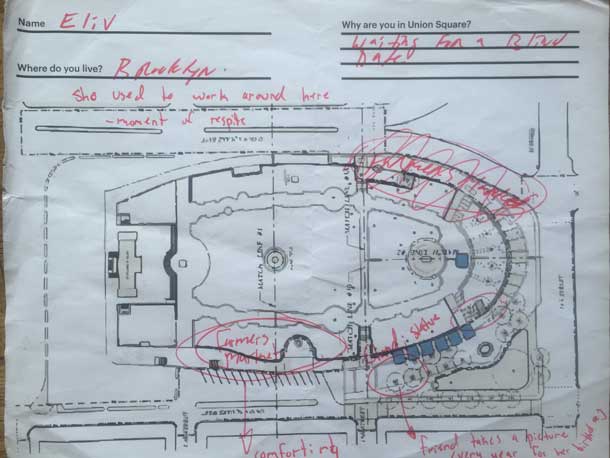
I discovered that it wasn’t always easy for people to orient themselves to the overhead view. More often, however, people were more interested in using the maps as a starting point for conversation. It was difficult to remind everyone to put their thoughts down on paper as they started to talk about the space. Since participants had trouble relating to the perspective, this approach was eventually scrapped.
To counter this, it struck me that it might be easier to capture all of that interesting observation by interviewing people as they walked around the space in question. This solved the problem of perspective; people were more likely to have opinions on the actual space than the translation of space as represented by a map. This also solved the problem of recording stories as they naturally occurred to people. This led me to using video transcription for the qualitative portion of Civic View.
Video Transcription
During the walkabout, a researcher interviews participants through conversation. The interview should follow best practices of design research and have a clear goal in mind. Later, this audio will be transcribed and coded for keywords and important phrases.
Qualitative data brings meaning to the context created by video and clarity to the biometric data. Additionally, through transcription and analysis, this data can be used by applications or mapping programs to provide high level insight into how multiple people view one area.
Data Stream 4: GPS and Mapping Data
GPS is a core component of the system and, along with time, is the data that ensures a participant’s experiences can be communicated in a scalable way. Luckily, this is one of the easiest types of data to capture. You’ll need a smartphone and a GPS app. I recommend Moves—not only is it free, but it is also one of the best apps for exporting GPS data.
Back-end Development
Once I had all of the system aspects in place and had collected sample data with a participant, it was time to put it all together into an interactive viewer. To do so, I worked with an old friend and game developer, Nick Koga. We discussed the different outputs, how the viewing tool should best be created, and then determined what our technical parameters would be:
- Live online
- Lightweight and load on the page quickly and without additional plug-ins
- Hack-able
- Able to load new data
The spine of this system is interoperability through the use of a time stamp, so we explored the use of JSON to organize the data. As the designer and researcher, I also wanted to ensure that every type of data collected was structured in a CSV file according to time. Altogether we were able to build a web viewer using Javascript, HTML, and CSS.
Next Steps
Communities are more than statistics on how many crimes have been committed or where the potholes are. We all know this, but don’t know how to capture and convey data on that deeper, emotional fabric.
Civic View is a call to fundamentally incorporate quantitative data into the interview and walkabout methods of design research. Its goal is to open up information about communities that is usually only accessible to ethnographers or those with deep personal and professional ties to the community.
Interaction Design is ripe with methods for understanding people in their own context. Through the use of simple, data-driven technologies, we can make those methods accessible to the public sector.
Civic View, if scaled and developed further, has the potential to bring personal, intimate experiences to the aggregate level. One can imagine that with many people and all of the available data from this type of tool, there will be opportunities to see where larger patterns exist. Currently, local governments are trying to work out new and different methods for hearing the voice of their citizens. Civic View demonstrates how designers can work to bridge the communication gap between citizens who are experts of their community and policy makers who are experts in crafting government services.