Design requires empathy and a deep understanding of users’ workflows and mental models, which is usually accomplished through user research. Generative research methods can be greatly improved through the use of collaborative design and research activities (most commonly referred to as participatory design), where end users work together to create an artifact involving their day-to-day work. By working closely with these end users, the product team is able to capture first-hand their attitudes, empathize with the target users, and understand what solutions may or may not be effective for the audience. Business origami is a quick and easy-to-explain collaborative design method that can be used to understand end users’ environments and teammates, as well as supplement findings from other qualitative research methods.
Participatory design activities, such as business origami, can complement the data gathered from interviews and observations by providing the end users’ own perspectives of their interactions with their co-workers and surroundings. From this data, artifacts such as personas and as-is experience maps can be created. Both of these artifacts can be useful for creating empathy and a common understanding of the target user across the product team. However, the data gathered using these two research methods might be biased in various ways by the designer, as well as by the participants.
Examples of bias include:
- Question-order bias: The order in which questions are asked.
- Leading/wording bias: The way in which questions are asked.
- Confirmation bias: The research questions that are guiding the interviews.
- Social desirability bias: The possibility of participants altering their behavior during observations to change how they are perceived by the researcher.
- Interviewer bias: The possibility that the interviewer’s body language or unconscious gestures affects the way interviews will answer a question.
While these biases may all be controlled to some degree by proper preparation and execution by the interviewer/observer, there is still potential for bias given that each participant has a unique background that is unknown to the researcher. Business origami shifts the dynamic of designer and end user in a way that minimizes the biases listed above by placing the end user in control of creating an artifact (as opposed to having the designer assume power through their control of the interview or through their position as an outside observer).
Introducing Business Origami
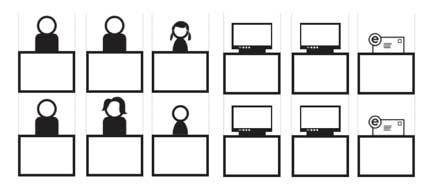
The goal of business origami is to have end users create a “map” of the various people involved in the ecosystem surrounding a specific product, design, or other solution (for example, a specific software product or an information kiosk in a public area). The product team members who are involved in the activity should take on the role of facilitators. The end users will place various small paper “icons” (see Figure 1) on a physical space (for example, a table or white board) to identify the people with whom they interact, the ways in which they communicate with each other, and the locations where these interactions take place. End users should also write relevant information on the icons or space. For example, end users could place separate icons for “engineer managers,” “engineers,” and “vice-president of engineering.” This activity is generally most effective when done in early or generative stages of user research for the following reasons:
- It helps generate empathy for a target user group by providing clarity on the environment and interactions currently involved in target users’ lives.
- By understanding the current ecosystem involving the target user group, designers can understand how to design most effectively for their target audience.
- The map that is created can be preserved and shared with others on the product team who were not physically present for the activity.
Business origami can also be an effective method to use when target users have many complex interactions with other people and technologies. By visually mapping out these interactions, the product team can quickly understand which interactions could be improved through software or indirectly modified or affected through the introduction of software (see Figure 1).

Preparation, Materials, and Execution of Business Origami
There are four big steps to running a business origami activity.
1. Outline goals and recruit participants
Before planning the actual business origami activity, it is important to decide the goals and who the proper participants are. For example, a past project I worked on involved understanding the workflow and interactions involving developers on the IBM Watson Solutions teams who worked with IBM’s clients to create software such as Watson for Oncology and Watson for Clinical Trials Matching. Both software were developed to assist clinicians with decision making about patient diagnoses, as well as identifying possible clinical trials for which patients may be eligible (given their diagnoses). My goal as a designer was to use this information to help design new web-based software to help less technical clients build their own similar products for different industries beyond healthcare. Therefore, I recruited a representative group of the developers involved in those projects. Business origami is generally most effective with 3-5 participants, since two end users may not have knowledge of all interactions and 6 plus participants may not all be actively engaged. Given these guidelines, I recruited two groups of four participants each (eight total). One group created a map for Watson for Oncology, and the second group created a map for Watson for Clinical Trials Matching.
2. Prepare the business origami activity
Business origami requires having a flat surface for placing icons. White boards and large pieces of paper (for instance, butcher sheet or cardboard) are ideal since they allow participants to write comments on the paper/board itself, in addition to arranging the icons. The designer who is facilitating the activity should ensure an appropriate space with these types of surfaces is available. The designer should also print off and cut out multiple copies of business origami icons. End users will arrange these paper icons to outline the various people, places, and communication methods (see Figure 2) that are involved in their day-to-day work. Depending on the type of end users involved, the designer may want to create other icons beyond the ones provided on the website above. For example, given the IBM Watson Solution team’s focus on healthcare, specific icons were made to represent male and female doctors and nurses.
When planning out a business origami exercise, leave blank the labels underneath each icon so that participants can fill in what they believe to be appropriate. Also, print off several “blank” icons (shown in Figure 2). For example, the label portion is included, but the top part is left blank so participants can draw in a new person or object that may be needed.
3. Introduce the business origami activity
Provide an overview of the activity and the goal before beginning. It is most important to emphasize that providing many details on the stakeholders and interactions is important, but that the artifact created should be understood by a third party that was not present during the activity and that is not familiar with the participants’ line of work. Generally speaking, these are the instructions that should be given:
- Use different icons to represent people, places, or things that are important parts of your work environment.
- Draw arrows between these icons to represent the ways in which they interact and communicate with each other.
- Write comments on the board/paper to help explain any important details.
- Make sure to think about anything that helps with those interactions and communications and to use icons on top of arrows as needed.
- There is no “right” way to map since each of you have had different experiences. You can also move or remove icons and comments if you realize that is needed.
4. Conduct and discuss the Business Origami activity
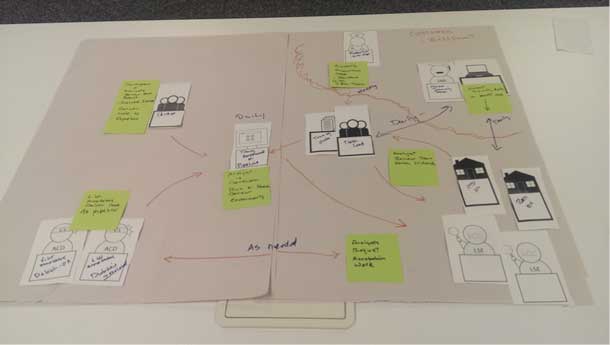
Spend between 20 and 45 minutes on the map activity to allow for enough discussion, creation of an initial artifact, and modification of the artifact. The designer should observe and answer any questions the teams may have, reminding them that there is no single “right” way to map out the people, places, and things involved in their work life. Fifteen minutes should then be spent to share artifacts with others who participated. If there are multiple teams, a discussion will also help identify possible similarities and differences between the artifacts. Below is an example of what completed maps may look like (Figure 3).
Feedback from Participants
The IBM developers said they enjoyed the activity since it was helpful for them to see the “big picture.” There were two main developer roles, and both appreciated the opportunity to learn more about the others’ work and interactions with the client. Some developers noted that the activity was difficult to understand at first given that they do not traditionally do “open” activities. This comment shows the importance of properly introducing the business origami exercise, as well as including examples of completed business origami activities. Product managers and other stakeholders who saw the completed business origami exercise also had praise, stating that the maps helped them to understand and empathize with their end users’ complex workflows.
Direct Input Creates Empathy
In participatory design activities, end users (rather than a designer) create artifacts that help inform the design and understanding around a specific user group and ecosystem. These artifacts could include the design of a digital artifact (like software), physical artifact (such as gallery or bulletin board), or service (checking yourself and your baggage in at an airport). By involving end users directly, the designer can gain a better understanding of end users’ perspectives and values, as well as understand the types of artifacts that may best meet their needs. Participatory design may also be effective if paired with other qualitative research methods that have potential for bias (such as interviews and observations).
Business origami is one type of participatory design that is (typically) a generative design activity. It can help a product team understand the various types of people involved, the objects and locations involved, and the flow of information.
For my work in industry, this method has been crucial in creating empathy for end users and their interactions with their teammates and their environments. Since the design team usually interacts with end users the most out of the various product team members, business origami can be a quick and powerful way to create alignment between the design, development, and product management teams. In less than an hour, an easy-to-understand artifact is created by end users and can be archive for reference. Business origami can also be done remotely if travel to end users’ workspaces is not possible or if end users are not collocated (either by screen sharing or through software such as Mural.)
[bluebox]
More Reading:
- More general information on participatory design can be found in to Michael J. Muller’s paper titled “Participatory design: the third space in HCI.”
- More information on biases can be found in the book, “Handbook of Survey Research,” written by Peter Rossi, James Wright, and Andy Anderson.
- Slides for an overview for conducting a business origami activity.
[/bluebox]

David Muñoz is a user researcher for IBM Watson. He holds a degree in psychology from Duke University and a masters in Human-Computer Interaction from Georgia Tech. He has six years of experience using various qualitative and quantitative research methods in both academia and industry