Imagine you are in a meeting with product managers, designers, and engineers to determine next steps for your mobile redesign project and the team is mired in endless debate.

Despite an hour of discussion, the team is still far from addressing the following questions:
- Everyone wants his or her feature on the home page but what is most important and useful for the end user?
- What pain points have users experienced and which are most important to address?
- We have a list of product ideas, but which ones should we implement first to maximize impact?
One way to put this debate to rest is by leveraging a user-centered process to inform decision making as opposed to relying on individual stakeholders’ opinions. Specifically, a quantitative Max Diff survey would allow teams to tackle any of these questions head-on.
First, we will introduce the Max Diff survey approach. Then we will share how the Max Diff methodology can be applied in a cross-functional organization to inform and drive strategic and product decisions. Finally, we will discuss the pros and cons of the method, common pitfalls, and ways to triangulate the data.
What is a Max Diff?
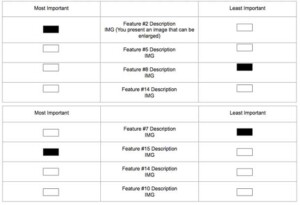
While traditional rating scales ask respondents to rate the importance or usefulness of pieces of information on a continuous scale (for example, from 1 = not at all important to 10 = extremely important), a Max Diff survey approach asks respondents to make tradeoffs among sets of product features or ideas. For example, the importance of “price” or “time left to purchase” for making a purchase decision. Respondents are presented with small sets of features and are asked to indicate which is the most important among the set and which is the least important (see Figure 2). Respondents complete this exercise for many sets of features (no more than a total of 25) in accordance with a statistically designed Max Diff model. All combinations of features are explored with each user seeing every feature but not necessarily every combination of features.
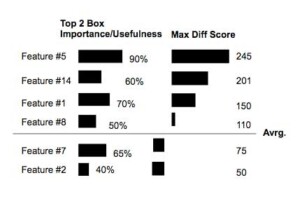
The number of times each feature was rated “most important” is then combined with the number of times it was rated as “least important” across all respondents who answered each group to determine the “maximum difference” of ratings or “Max Diff score.” Each Max Diff score is then indexed around 100, which equals the “average” index score.
Max Diff scores above 100 are more important/useful than average and those under 100 are less important/useful than average. Figure 3 illustrates how the data would look for the traditional rating scale and Max Diff score. Respondents may rate many (or even all) features as important, but the Max Diff score allows you to see which are relatively more important/useful. Understanding these differentials in the scores translates to a priority for specific design improvements or design directions.
Max Diff Provides Priorities for Design
As user interfaces grow ever smaller (for example, mobile phones, smart watches, vehicle displays), it is becoming progressively more challenging to maximize the use of limited screen real estate. The Max Diff survey approach can help product and design teams make the most of their real estate to satisfy both user needs and business goals.
We recently leveraged Max Diff to redesign a portion of the Groupon experience for all devices. We sought to determine the optimal prioritization of content on a key page to inform the redesign process. For example, we tried to understand the relative importance of specific information elements such as merchant info, price, and location. Having the quantitative data on hand has been instrumental in driving the design direction by providing a rationale for decisions made by designers and product managers. For this reason, it is a tool for maximum impact.
Combine Data to Understand “Why”
UX researchers rarely look at a problem from a single lens as it is only one piece to the puzzle. The Max Diff approach is no different. There are various ways one can combine Max Diff data with other data sources to tell a complete story.
Max Diff surveys are great at explaining what, but weak in understanding the why. For this reason, a Max Diff survey should be paired with a qualitative research method. When analyzing the data, having the qualitative insights will help to better understand why certain features yielded a higher Max Diff score than others. For example, we found that a specific feature on the page had a low Max Diff score, but internally we felt it was an important part of decision making. Baffled, we looked back at the qualitative data that had been collected and came to the conclusion that respondents were going to a competitor site to get more detail. Our implementation wasn’t good enough.
Another great source of data would be A/B testing. As we know, what people say and do is not always the same. For example, if a specific feature was rated highly but does not lead to improved metrics in A/B testing, perhaps the implementation needs to be re-imagined. Conversely, if a specific feature was rated poorly but outperformed the control in A/B testing, then it suggests that the feature was more useful to respondents than they consciously realized.
Customer support call logs also provide a rich data source to combine with Max Diff data. What’s nice about this avenue is that the data is already there—no need to fund another study. For example, you might find that a specific element is rated poorly and you’d like to improve upon it; uncovering customer calls about this specific area can help you understand why.
Any combination of these additional resources will help tell a better story when assisting your team to understand the results.
Max Diff for Product Roadmap Planning
Beyond specific projects, the Max Diff approach can be used to inform overall corporate strategy and priorities. Every company has a limited pool of resources, so executives must weigh different inputs when deciding which projects to approve and which to cut. The Max Diff approach can inject the voice of the customer into the conversation to help answer the question of which customer pain points deserve the most attention and which proposed features have the most perceived merit among respondents. In turn, this will help to ensure better customer satisfaction and delight.
The approach is very similar to the approach used to make decisions about individual features. However, rather than an exercise with product features such as “price” or “time left to buy,” this approach asks respondents about known pain points or proposed features. An example pain point might be, “It is difficult to compare prices across products.” An example proposed feature might be “Make it easier to compare prices across products.”
One of the benefits of the Max Diff approach is that it can clarify both the relative importance of the problem as well as the relative importance of the proposed solution. However, depending on the other problems and features included in the Max Diff survey, the importance of the problem and the importance of the proposed solution may not correlate. That is, the set of proposed solutions in the Max Diff survey may not map perfectly to the set of listed problems. For example, you may wish to determine the relative priority of a new idea that does not necessarily address a known pain point. Including such ideas in the Max Diff survey can change the overall priority of the set of solutions you include.
Once the data is collected, visualizations can be used to summarize the key insights from the research (see Figure 5). For example, a 2 x 2 plot can be created that shows the perceived importance and reported incidence of specific customer pain points. This can help business leaders understand both the impact and frequency of customer issues.
![Scatterplot of product features on an x axis (percentage of reported incidence) and y axis (Importance of addressing the issue [0-200])](https://uxpamagazine.org/wp-content/uploads/2016/07/16-3-Shokrpour-Katz-Fig5-1-300x150.jpg)
Pitfalls to Avoid
Related to the redesign efforts, be cautious not to fall victim to thinking there is a single, right answer. It is best to generate two or three design ideas with strong hypotheses and conduct additional research to hone in on an approach. It is also a best practice to ask respondents to evaluate no more than 25 separate features or pain points so that the survey does not become overly tedious for respondents.
It’s important to involve your key stakeholders throughout the survey planning process at each stage, including quality testing the survey itself. Working closely with a lead product manager and designer will help prioritize what features should go into the survey. This partnership will become valuable later on when you are sharing your results. For example, stakeholders may ask why certain features were not included in the survey. Here, your product and design partner will help you explain the internal prioritization that took place.
Consider both traditional rating data and Max Diff scores when analyzing data for each feature. By only using the rating scale results, there is a high chance that many features will be considered useful/important, making the ability to differentiate low. Conversely, using only the Max Diff score, there is a chance that features will be completely disregarded when they are still important. For example, a feature may have a top two box usefulness rating of 50% and an index score of one. This feature is useful or very useful to half of the respondents, but if they had to choose between this feature and any other feature, they would always choose the other features.
Applying the Max Diff Approach to Your Project
The next time you are in a meeting with endless debate about how to prioritize product elements on a page or a product roadmap, suggest running a Max Diff survey to answer key questions and to drive strategic direction. It is a powerful tool and is more impactful when you can triangulate the data with other sources (such as analytics and customer support data).
Get creative! The Max Diff approach is a collaborative effort for a cross-functional team and invites team members to feel ownership over the results. Finally, the Max Diff approach helps to further establish you and your research function as a key partner and decision maker.
We’d like to thank Christina Hildebrand from Consumer Evaluation & Insights for her partnership and mentorship throughout our Max Diff efforts.

Anosha Shokrpour is a Director of User Experience Research at PayPal. With 15+ years of experience in User Experience Research. She has scaled teams and led research at PayPal, Groupon, and eBay. Anosha has played a pivotal role in driving research roadmaps for zero-to-one product initiates, leading mixed methods qualitative and quantitative research, and triangulating insights to drive business decisions and results

Mike Katz is the Global Director of UX Research at Electronic Arts, leading research teams across 4 countries on 2 continents, dedicated to delivering industry leading insights to create great experiences that players want to play. Prior to EA, Mike held leadership and senior researcher positions at Facebook, Groupon, eBay, and Yahoo!