Web analytics deserves a place in the toolkit of every usability professional working with websites. It gives you another way to approach problems, helps you communicate the value of your work, and makes it easier for you to hold yourself accountable. It does this by providing another source of quantitative data, one with quick access to information about what users are doing on your website. Also, web analytics tools are well-suited to measuring website performance from a business perspective.
One of the early projects in my career was a heuristic review of a client’s website. The client, Learning Care Group, is the second largest provider of child care in the USA. They have a website for each of their five brands of child care center. The ultimate goal of the evaluation was to make one of the sites easier for users to find a child care center near them and contact it to arrange a tour. I reviewed the site, described some potential problems, and recommended design changes.
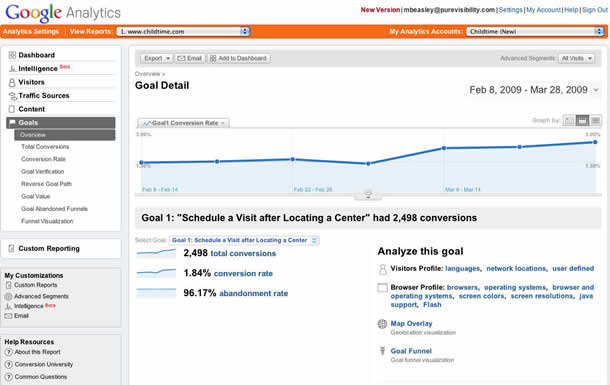
Fast forward a few months. My recommendations had worked their way through the development team and gone live on the website. We were eager to know if the changes made a difference. Unfortunately, it can be weeks between the time parents tour a child care center and when they actually enroll. For more immediate feedback, we watched the number of people who contacted our client about taking a tour. We were fortunate to have access to Google Analytics, which had been set up for their websites. Within days of the changes going live, we were able to see that more people were submitting the form on the website than before the design changes (see Figure 1).
About Web Analytics
Web analytics is the practice of using data to answer questions about what users do on websites. The name “web analytics” is also used to describe the tools you may use to obtain these data.
For this article, I’m going to focus on Google Analytics, a free tool that has been adopted widely by people with a large variety of backgrounds. The easy access to data about websites means that business leaders may turn to it for their earliest information about how their business is doing. Marketing people and people working with search engine optimization turn to Google Analytics to determine the effectiveness of their marketing efforts.
Google Analytics and similar tools use embedded JavaScript to keep track of every time a page on a website loads. It takes this small amount of data to create a lot of information about user behavior—although web analytics can never tell you why anyone did anything. Web analytics users indicate certain pages on their websites as critical to their business and monitor how many people get to them. These pages are called “goals.” Unfortunately, this term collides with another usage that is common to usability: the premise that users have goals they want to accomplish when using a website.
Choosing Analytics Goals
Why does your website exist? This is the fundamental question to ask before you can start measuring website performance. Learning Care Group claims more than one purpose for their websites, but my project was focused on getting more parents to enroll their children in child care. To accomplish this, the Learning Care Group sites provide information about their child care centers, a way to search for a center, and two ways to contact Learning Care Group and schedule a visit to a center: a phone number and an online form.
Tracking how many people contact Learning Care Group provides an immediate measure of how well the website is performing. After a parent completes the form, he or she is taken to a “Thank you” page (see Figure 2), which is the goal page with a unique URL that can only be reached intentionally rather than accidentally. Unfortunately, web analytics can’t track how many people call the listed phone number. However, there are other ways to track the calls, such as setting up a separate number that’s only used on the website.

On other websites, options for actions to track include when a user makes a purchase, downloads a white paper, contacts the sales team, or forwards an article to a friend. There are three general categories of actions you can track to measure the effectiveness of a website: e-commerce, gathering information from the user, and engagement. These actions differ mainly in how far removed they are from a business’s bottom line.
E-commerce
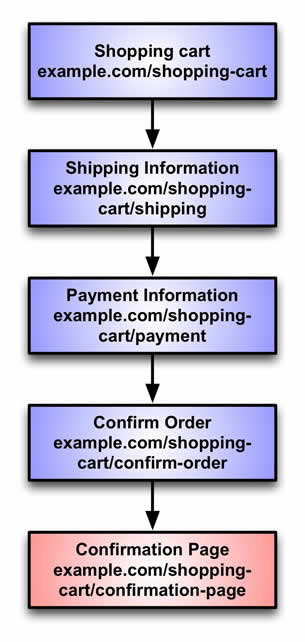
The most obvious option is buying something directly from a website. Amazon is a great example of a company that has built its business on e-commerce. For Amazon, one thing you’d track would be how many people complete a purchase, as well as how many people give up at each step of the transaction (see Figure 3). Using web analytics, you identify the URL of the confirmation page the user sees after completing a purchase and track how many people reach that page.
Gathering Information from the User
This category covers a wide variety of things for users to do. It could mean that the user contacts the sales team to ask for a quote, provides their email address to download a white paper, or signs up for a free account on a website. What all of these actions have in common is that even though they don’t directly make money the way e-commerce does, the business expects to make money off of some portion of them in the future.
On Flickr, for example, users upload and share pictures after signing up for a free account. Most users will only ever have a free account. Some portion, though, will find the service so useful that they’ll upgrade to a “Pro” account where they pay an annual fee for greater service. Learning Care Group’s websites are another example of gathering information from the user.
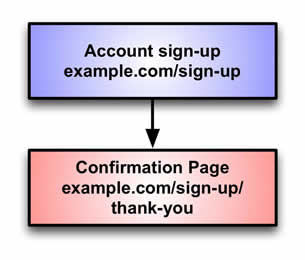
The effectiveness of the site is tracked by measuring how many people reach a unique URL after completing the action (see Figure 4). This can be a sticking point because websites may have forms that don’t take the user to a confirmation page. To track this activity in analytics, you will have to change how the form works.
Engagement
Another key business goal is to keep people engaged with the site, to get them coming back often, reading lots of material, or learning from content on the site. It can be hard to see how this ties in with profit, but it could be just one of a few business goals. For example, sites like Digg and Reddit want users to create an account, but unless those registered users keep coming back and interacting with the site, it doesn’t matter whether they created an account or not. These sites likely measure and analyze factors such as visit frequency and the number of articles read, which would help make the case for why companies would purchase advertising on their sites.
Instead of identifying a specific page that people may reach, tracking this goal entails finding a metric that makes sense—such as the amount of time spent on a site or how many pages a user viewed. With some technical know-how or the help of a developer, you can also track user actions like downloading a PDF, watching a video, or interacting with a Flash widget. The important thing is to go beyond simply saying that users should visit lots of pages on the site or watch a lot of videos, and to articulate why it is important that they do so.
What Can You Do with These Measurements?
Prioritize
After you’ve gone through the process of picking what is important to measure according to business goals, you have a framework for making decisions about what problems you want to fix and what can wait. You can prioritize projects according to how directly they affect a business goal and the importance of the goal to the business.
Look for Problem Areas
You can look for parts of the website that aren’t working well for users, which is a big subject, and well worth studying. You can do this without identifying goals, but stated goals make it easier to see how your site influences users to take action and help prioritize where to turn your attention.
Experiment
Maybe you have already made design changes and validated their effectiveness through usability testing. Web analytics, however, is a way to hold yourself accountable by measuring how well the changes work in the real world.
If you took the time to identify measurable actions on the site and prioritized your usability work accordingly, wait a couple of weeks after implementing the changes. Then compare the percentage of the site’s visitors taking action to the percentage that took action prior to the changes, and determine if your modifications really affected user behavior.
Monitor the Site
If you are keeping an eye on your web analytics tool and see a sudden drop in conversion rate, that means one of two things: your users have changed their behavior for some reason or the site has changed. This should be the start of some detective work for you.
Conclusion
There’s a lot more to say about web analytics and this article is just the tip of the iceberg. This orientation toward measurable outcomes may be a change for many usability professionals with regard to how they approach projects. It can feel dangerous to tie your work so directly to website performance and revenue. However, web analytics is a great opportunity to gain even deeper insight into your users and communicate the value of your work.
[greybox]
Text from Figure 3
Flowchart with five boxes. Each has a step in a purchase and a sample URL.
- Shopping cart (example.com/shopping-cart)
- Shipping information (example.com/shopping-cart/shipping)
- Payment information (example.com/shopping-cart/payment)
- Confirm order (example.com/shopping-cart/confirm-order)
- Confirmation page (example.com/shopping-cart/confirmation-page)
[/greybox]
[greybox]
Text from Figure 4
Flowchart with two boxes.
- Account sign-up (example.com/sign-up)
- Confirmation page (example.com/sign-up/thank-you)
[/greybox]网站分析方法在每个专注于网站的可用性专业人员所使用的工具中都占据一席之地。它提供了另一种解决问题的方法,可帮助您传达您工作的价值,让您轻松一展身手。该方法通过提供另外一种定量数据源来实现此目的,通过该数据源可以快速访问有关用户在您网站上所执行操作的信息。这篇文章讨论通过网站分析可以度量的内容,以及如何在网站上选择要度量的特定用户操作。
文章全文为英文版ウェブ解析はウェブサイトのユーザビリティに携わる者のツールキットに必ず備わっているべきものである。問題にアプローチする別の方法を提供し、ユーザビリティの研究の価値を伝える手助けとなり、結果の説明をしやすくしてくれる。定量的データの情報源として、そこからユーザがサイトで何を行っているのかという情報に即時にアクセスできるものを提供してくれる。この記事は、ウェブ解析を通じて何が測定できるのか、測定の対象となるウェブサイト上の特定のユーザ活動をどのように選択するのかを論じている。
原文は英語だけになります