We’ve all taken surveys that make no sense. The questions make incorrect assumptions, leave out an obvious answer choice, or make questions you don’t want to answer “required”.
Many of us have also conducted a survey only to realize after we collected data that it didn’t exactly get at what we wanted to know.
Surveys are so common, but questionnaire writing is an often-ignored skill in the UX research toolkit. The good news is you don’t need to be an expert to write better surveys. You just need to follow some simple guidelines to create survey questions that are usable and useful.
Here are 10 key guidelines for writing usable surveys.
Rule 1: Start with the end
First, make sure that a survey is the best way to answer the questions you need answered. A survey is useful if you want to measure something or test something. If you are looking to understand “why,” or if you don’t really know how to think about the issue yet, you should start with qualitative research. Qualitative research is useful because it is exploratory, so you can discover new information.
Once you conduct a survey, you will only get answers to questions you thought to ask, so make sure you know what the relevant topics are before you start.
What decision are you using this data to make? For each question, think about what you will learn when you have data for it. It’s sometimes useful to put in dummy data and try to analyze what that data pattern would mean. That is a good way to make sure the question is useful and clear.
Rule 2: Include screening questions
Identify who exactly you want to survey. What are their characteristics? Write screening questions to make sure the respondents to your survey have these characteristics. These questions should be programmed so that respondents who don’t provide answers consistent with who you’re looking for are unable to proceed to the rest of the survey.
Even if you are using a customer list, your questionnaire should always start with screening questions. You want to make sure the respondent is an actual customer, and not their teenaged son, for example.
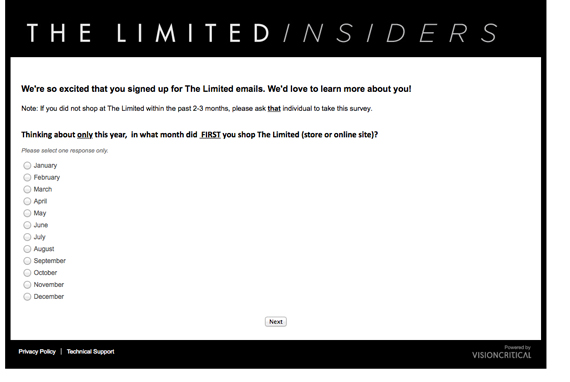
Instead of screening questions, this survey instructs the respondent to send the survey to someone who shopped at The Limited more recently (see Figure 1). I’m sure that instruction was never followed.
Screening question design is particularly important if you are offering incentives (for example, money) to participate. Sometimes money motivates people to lie on your survey. A few strategies to consider:
- Red Herring Answers: Include answer choices that are not real (such as non-existent brands). Don’t allow respondents who select those answers in your survey.
- Factual Questions: Ask questions that are hard to search for. Cut people who answer incorrectly.
- Track IP address: Block respondents who try to complete your survey multiple times from the same IP address.
- Read Comments: After data collection, remove data from respondents who provided nonsensical, open-ended comments.
If you don’t include screening questions, you may end up with data from someone who was not really qualified to answer your survey.
Rule 3: Go from general to detailed
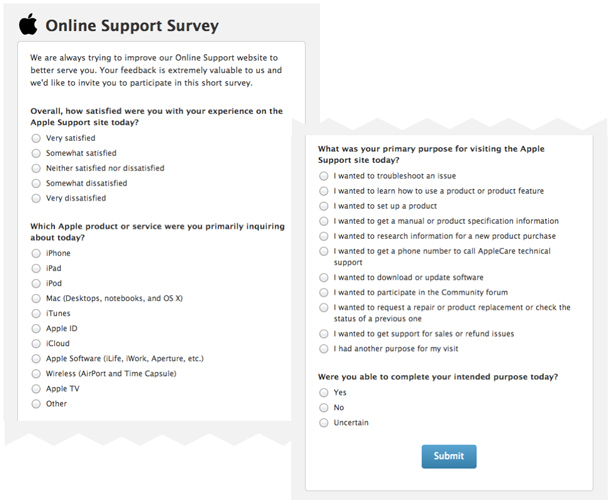
Your questionnaire should be written so that the most general questions are asked first, and more focused questions are asked later. Generally, questions on the same topic should be asked together. This survey (see Figure 2) does a nice job of grouping questions. It starts with a question about Apple Online support overall, then follows up with questions specific to your product and experience.
Rule 4: Ask about one thing at a time
Asking about only one thing at a time is essential. Otherwise, respondents can’t accurately answer questions and you will be unable to interpret your data.
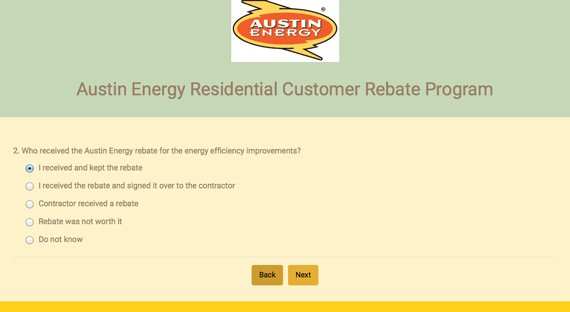
Take a look at Figure 3, and specifically answer choice 4. This question seems to be asking about an event: Who received the rebate? But answer 4 is a judgment call: Was the rebate worth it? That should be its own question. As written, it would be impossible to say what percent of rebates went to homeowners and what percent to contractors—the point of the question—because including “Rebate was not worth it” as an answer choice skews the data.
Rule 5: Stay away from required questions
We make questions “required” because it is important for us to measure whatever we are asking about. But required survey questions are something of a fantasy.
No one is really required to answer your questions. People always have the option of closing your survey if they can’t skip a question they don’t want to answer, or where the answer choices don’t reflect their opinion. I personally do this all the time. I doubt I’m alone (sometimes I write to the survey sponsor to complain, too). That means that instead of losing one data point you lose an entire participant.
What to do?
- Make sure you have a comprehensive list of answers choices, including “Other,” “Not Applicable,” and “Prefer not to answer.” This lets everyone have something to select. That way even if a question is required, there is a non-answer choice that respondents can select if they don’t want to answer.
- Only make questions required at the first attempt. If a respondent tries to proceed without answering the question, you can throw up a message such as “Please select an answer.” If they try to proceed again without answering the question, just let them through. Later you can decide if you want to analyze the data from people who answered all questions, or maybe those that answered only a percentage.
Rule 6: Include all (and only) relevant answer choices, including “Other,” “Not applicable,” and “Prefer not to answer.”
Look at your answer choices with an eye to completeness and answerability. This seems so easy, until you field a question like this (Figure 4):
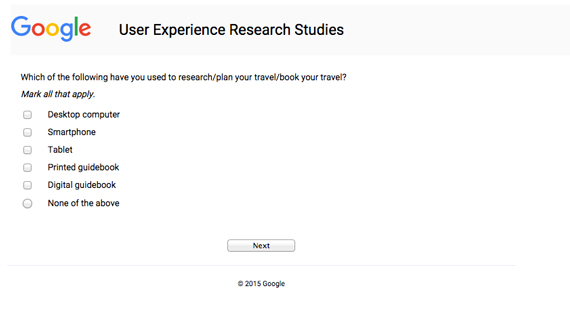
How did “Digital guidebook” make the list, but not “Laptop computer”? It’s frustrating for a respondent not to see their preferred answer on the list, particularly if it is a common one. It’s probably even worse when you realize you have no idea what percent performed this task on a laptop.
Use existing information, qualitative research, online searches, and testing to make sure your answer choices reflect the most likely perceptions/experiences of your respondents. And per rule 5, make sure to give them an out by including “Other” (ideally with “specify” as follow up), “Not applicable,” and “Prefer not to answer” options.
Make sure the answer choices match the questions. If you are asking a factual question like, “Did you complete your purchase in this visit?”, do not ask respondents to rate how much they agree with the statement. The event either did or did not happen, so it should be a yes or no question.
Below (see Figure 5), the respondent is being asked to rate how “satisfied” they are with “Store employees were helpful.” This is awkward because the question and the answer both include a measure of quality—helpfulness and satisfaction. In this case it seems what they really want to know is how helpful customers perceive the employees to be. This question should therefore ask respondents to rate helpfulness, not satisfaction. A similar change could be made to the two other items in the battery below.
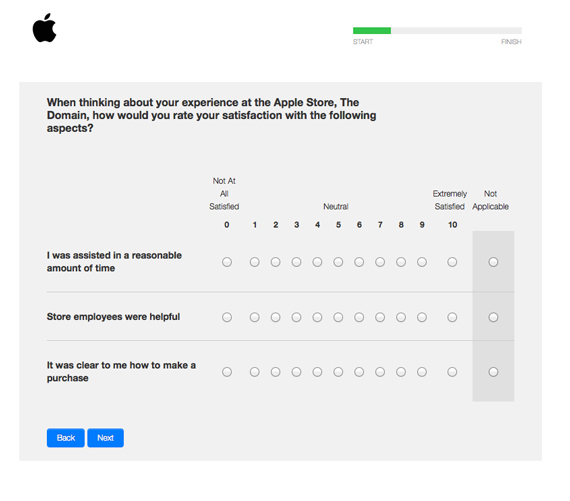
Also, make sure that questions that ask about similar concepts use the same scale throughout the survey. For example, if the survey uses a 0-10 satisfaction scale (as in the example above,) make sure that other satisfaction questions use the same scale and don’t suddenly change to asking for Extremely Satisfied to Not at all Satisfied ratings. That will make it very difficult to compare data across questions.
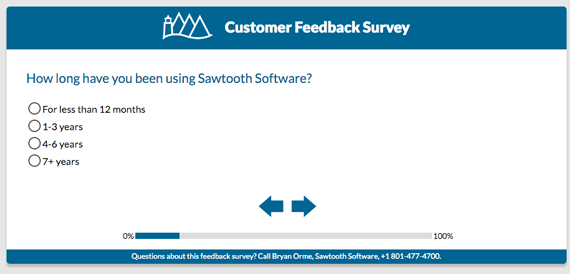
This next questionnaire (see Figure 6) asks how long I’ve been using their survey software. I’ve never used it, but I attended a conference, so I’m on their mailing list. It seems untrue to say I’ve used the software less than 12 months since I’ve never used it and am not currently using it. This question is essentially asking respondents to lie to be able to proceed with the survey.
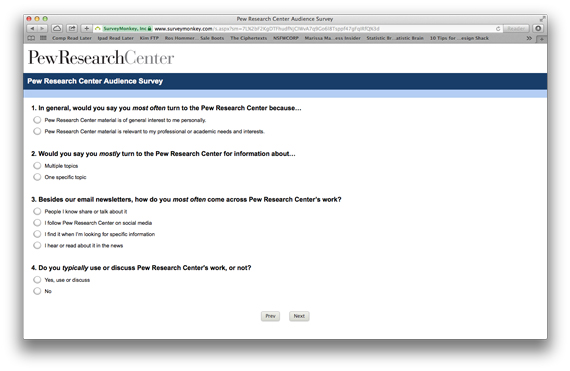
In this set of questions from The Pew Research Center (see Figure 7), the first three questions assume the respondent “turns to” Pew Research Center for something, and question 3 assumes the respondent turns to Pew for things other than their newsletter. I subscribe to the newsletter, but I don’t turn to Pew for any other reason. How should I answer question 3? Without a “none” answer choice, the percentage for all the other responses will be artificially inflated.
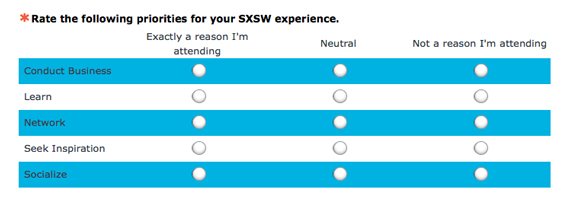
In this example from South by Southwest (see Figure 8), the overall question and the middle answer choice are ambiguous. The question should read something like, “Are you attending SXSW for these reasons?” It should not ask for a rating in the question and then provide answer choices that do not include a rating. The answer choices should then be, “Yes, I’m attending exactly for this reason,” “Yes, I’m sort of attending for this reason,” and “No, I am not attending for this reason.” What does it mean to be “Neutral” in this context?
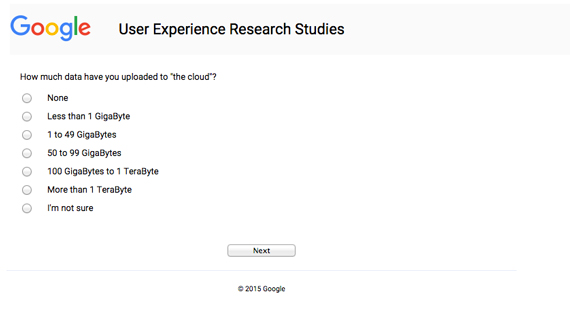
Bonus rule 6.1: Only ask questions people can answer. If you ask a question, respondents will tell you something, but is that information they can be trusted to report? Think about that before you ask something about lifetime cloud data storage utilization (see Figure 9):
Rule 7: Figure out what you want to report
The Net Promoter Score (NPS) metric is popular because it reduces (essentially) satisfaction ratings to just one number. NPS asks a question that is some variation of “How likely are you to recommend this brand to a friend or family member?” on an 11-point scale of 0 – Not at all likely to 10 – Extremely likely.
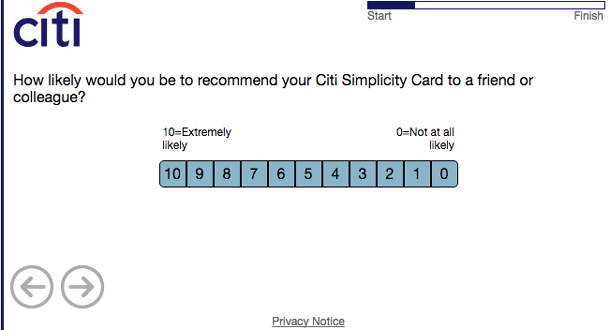
NPS is then calculated by subtracting the percent of respondents that rate themselves 0-6 from the percent that rate themselves 9-10. That gives you one number—your brand’s NPS—that goes from -100 to 100.
While there is hype and controversy about NPS, it persists because everyone knows what you mean when you say NPS. Having one number means everyone is talking about the same thing. Contrast that with the many ways you could report on data using rating scales:
- A mean (ideally with a standard error)
- % of reach response
- Top box: % rating 10 on 0-10 scale
- Top two box: % rating 9 or 10 on 0-10 scale
- Top 4 box: % rating 7-10 on 0-10 scale
- Bottom box: % rating 0 on 0-10 scale
- ….you get the point
When we use text responses, the issue of what to report is still there. Let’s say you have a question such as:
How was your shopping experience on this website?
- Excellent
- Very good
- Good
- Fair
- Poor
What will you report here? You could report the percent who selected each response, but then you are reporting five percentages. The website owner might want the first three responses all reported as a net percent—anyone who answered some variety of Good plus. Others might want to track only the percent calling the site Excellent.
This is especially important if you plan to track changes over time. You should think about what kind of changes count as improvements and declines. For example, if percent of Excellent decreases and percent of Poor decreases, does that mean things got worse or better?
What if you want to know a specific number? For example, you want to know the average percent of the devices in homes that are “smart”? (This would be problematic question for a few reasons, but let’s assume you want to ask it.) In this case you would ask respondents to fill in a percent. You would not want them to select from a list of ranges:
- 0-10%
- 11-20%
- 21-30%
- Etc…
- 91-100%
If you used a list or ranges, you would only be able to report proportions of each answer; you would not be able to report an average overall percentage of smart devices. This is because you wouldn’t know what percent the people selecting 0-10% actually have. Is it 0%, 10%, or something in between? These two numbers would have different implications for the overall average. You could assume the midpoint for each range, but it’s still making things up. If you know you want to report a number, ask for a number.
Is there a correct thing to report? No, but you should be thinking about what you want to report while you are writing the survey. When you write questions, think about what you want to report as you select answer choices.
Rule 8: Keep the open-ended questions to a minimum
Most survey questions should be closed-ended. That means each question should have a set of answers the respondent can choose from. If you find yourself wanting to include more than three open-ended questions in a survey, you shouldn’t be doing a survey.
Surveys are great when you want to measure something, but useless when you are looking for new information. If you have a lot of questions you cannot write a complete set of anticipated responses for then you should be doing qualitative research to define those.
Respondents to surveys tend to leave fairly short responses to open-ended questions. Adding prompts for additional details or instructions such as “Please be as detailed as possible” are of limited effectiveness. That means that if you want thoughtful responses, you should not ask too many of these questions. You might get useful data from the first two questions, but by the third, your respondents will just start skipping questions.
New methods that allow respondents to leave audio or video responses (Living Lens and Voxpopme provide these services) can make it easier to get more detailed feedback, but you still need to analyze that data.
Analyzing open-ended comment data correctly is complicated. Either a person or a computer needs to read and categorize the comments, and that’s after a set of categories is created to put those comments into. Doing this correctly is an art, and up until now, the language processing programs available have not proven to be that good at it.
In the end, it’s hard to respond to open-ended questions and it’s hard to analyze open-ended questions. Use them sparingly.
Rule 9: Test your questions
If you would test your design, you should test your questions, too. It’s harder to write questions than it seems, but testing them is easy:
- Read your questions and answer choices out loud. Things that don’t make sense will tend to reveal themselves when you say all the words aloud. Seriously, speak them out loud, not in your head.
- Ask another person to answer your questions. Ideally this would be a target survey participant, but it could be a person from another team that doesn’t know your project. It could even be your roommate. Have them read the question first without showing them the answers. Do they think the question is asking what you think it’s asking? Treat it like an open-ended question for testing. Let them tell you what they would answer and make sure that response is on your list of answer choices. Then show them the answer list. Does it make sense?
Rule 10: Test your programming
Print out your questionnaire on paper. Make sure the survey as programmed is the same as the survey as designed. Read every question and answer. Proofread. Look at the survey on different devices and in different browsers. See if questions that are supported to be randomized or rotated really are being randomized and rotated. Click through every possible combination of answer choices (if you have skip logic), then make sure that data is cleared before you launch the survey.
You should consider doing a soft launch where you first send your survey to a small group within your sample to make sure it works as expected. Once you field your survey, keep an eye on the data as it comes in. Make sure the data looks reasonable and investigate anything that look suspicious—like a lot of respondents being screened out at an unexpected question.
Following these guidelines should allow you to write surveys like a pro and collect data you can actually use to drive better user experiences.