Gloria Rorty, the star of this story, was curious by nature. In college, she had taken courses in art history and basic statistics. When the Web became integrated into everyday life, she found she was interested in the interstices as much as the threads. And she found herself now in a network especially suited to her education: website design, remote assessment, and quantitative analysis. She sharpened her pencil and flipped open her notebook. Here it was: her big chance.
The Challenge
As a usability specialist at Aesthetics.com, a company specializing in the design of websites for clients in the visual arts, Gloria had been assigned to a new client and she decided to make the most of an assessment opportunity. Executives at Postmodern and Such, a retail firm specializing in art supplies, had commissioned a redesign of their company’s website. Gloria had met with the leaders and realized that these MBA types were going to want evidence that the new site served its target audience better than had the old. “When you present the changes,” one had said, “be sure to tell us what the potential users thought about the original and redesigned sites. The basic numbers are good to have around.”
The basic numbers, she knew, would also help her to justify the changes she was making so that this site, as well as future sites, could be imagined as a set of variables over which she had control. She had a theoretical model for an ideal site for the client, and she wanted to measure the variables that would yield that ideal.
Creating the Model
Drawn from her current web design experience, she began with a model that would allow her to examine the relationships.
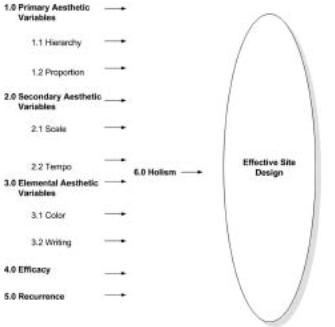
Gloria had chosen five variable sets as predictors of an effective site design: primary aesthetic variables, secondary aesthetic variables, elemental aesthetic variables, efficacy conditions, and recurrence. Because she knew that these variables had to be unpacked, she delineated each into component parts. So, for example, the primary aesthetic variables were broken down into conditions of hierarchy and proportion, efficacy was understood as the user’s ability to perform an information retrieval task within the site, and recurrence was defined as the user’s desire to return to the site.
Each of the variables was also understood to be associated with the holistic impression of the site. Hence, the five predictor variables (X) were—if all went well—going to be effectively associated with an outcome variable (Y), the holistic score. The holistic score would demonstrate that the new site served its target audience.
To assure that Gloria’s variables were going to be understood by the users in her study, she prepared a series of Likert-scale questions. Defining “scale” as a user judgment based on harmonious comparisons of visual elements (such as logo design), her first Likert statement was as follows: “The site is designed so that the scale of the visual elements is consistent throughout the site.” Potential responses would fall between “very strongly agree” (scored 6) and “very strongly disagree” (scored 1).
As an adjunct instructor in her city’s college, Gloria had access to two distance learning classes of seminar students who could serve as potential users of the original and re-designed sites. She wanted to use her students as reviewers but realized that their impressions of what was very good—that “strongly agree” response—would differ vastly, as might the other awarded scores. She therefore needed to train them to make similar judgments according to her interpretation of the scale and its values.
Gloria taught her seminar in a distance learning format, so she could easily employ screen recording software with voice-over to tour various aspects of the sites before and after redesign. As she toured the original and revised sites, she demonstrated which site features would receive, for instance, a score of 6 on a targeted dependent variable and which would receive a score of 2. She also prepared a brief written description of each score level from 6 to 1. The online seminar reached consensus through conversation about evaluative differences and similarities.
She planned a system in which the two sites would be reviewed twice, with each set of scores recorded independently of the other. That is, thirty-one students in one graduate class, after watching her training video, would use the Likert scale and award pre-redesign scores. Then, twenty-seven different students in the other graduate class would use the same scale and award post-redesign scores. The total score range would, thus, be set for 12 (the highest score for each of the variables in Figure 1) to 2 (the lowest score). If any score differed by more than one point—a score of 6, for example, and a score of 4—that score would be considered discrepant, and she would resolve the discrepancy herself through adjudication by validating either the higher or lower score. Such decision rules, she realized, were part of pursuing reliability. Without that elusive sense of inter-user agreement, she knew that her statements regarding post-redesign improvement could be questioned.
When the scores came back—the entire evaluative process had taken a week—she was thrilled to see that the level of agreement was quite good. One quarter of the evaluations needed no adjudication at all, and 53 percent needed adjudication on only one or two traits. With this measure of inter-user agreement in hand, she was ready for the first stage of analysis.
The Familiar
Gloria began with a basic question: could statistics show that the site had been effectively re-designed?
Using the SPSS 15.0 statistical software, she began her analysis of the pre-redesign (n = 31) and post-redesign (n = 27) scores. She also used an independent sample t-test (a mathematical test designed to demonstrate score differences between two groups) to see whether a statistical difference set at p < .05 (the lowest probability standard to avoid non-significant results) had been reached between the pre-redesign and post-redesign sites. She prepared Table 1 to demonstrate these measures. As she looked at the table—an empirical argument that would justify the redesign of the client’s site—she realized that hierarchy, proportion, color, efficacy, and holism had achieved statistically significant difference. The post score means were statistically higher than the pre score means—good news for both Aesthetics.com and Postmodern and Such. Indeed, her redesign had created such a vast difference that in four out of the five cases there was better than a 99 percent chance that the difference had been caused by her redesign efforts and not by sheer chance.
When a significant difference was not achieved, she reasoned, there could have been two causes: the site was in solid shape to begin with, or her explanation of the variables was not clear enough for users to discern a design shift.
Table 1: Pre-redesign and post-redesign scores: means and tests of significance.
| Variable | Mean | Range |
Standard Deviation |
r test | p Statistically Significant Difference |
||||
|
Pre-Redesign (n=31) / Post Redesign (n=27) |
|||||||||
| 1. Primary Aesthetic Variables | |||||||||
| 1.1 Hierarchy | 7.61 | 9.51 | 12,4 | 11,6 | 1.33 |
1.93 |
-4.22 | <.0001 | Yes |
| 1.2 Proportion | 8.12 | 9.33 | 11,6 | 12,7 | 1.45 |
1.68 |
■2.92 | .005 | Yes |
| 2.0 Secondary Aesthetic Variable | |||||||||
| 2.1 Scale | 7.45 | 8.25 | 10,2 | 12,2 | 1.87 |
2.44 |
-1.42 | 0.16107 | No |
| 2.2 Tempo | 8.48 | 9.51 | 12,2 | 12,4 | 2.33 |
2.31 |
■1.96 | 0.0964 | No |
| 3.0 Elemental Aesthetic Values | |||||||||
| 3.1 Color | 8.51 | 9.85 | 11,2 | 12,5 | a/ |
1.89 |
■2.28 | 0.0264 | Yes |
| 3.2 Writing | 7.41 | 8.11 | 9,6 | 12,2 | 1.05 | 2.3 | -1.4 | 0.1396 | No |
| 4.0 Efficacy | 6.45 | 9.62 | 12,2 | 12,7 | 3.45 |
1.36 |
■4.48 | <.0001 | Yes |
| 5.0 Recurrence | 8.32 | 9.03 | 12,6 | 12,4 | 1.34 |
2.05 |
■1.57 | 0.1225 | No |
| 6.0 Holism | 7.8 | 9.25 | 10,4 | 11,8 | 1.66 |
1.09 |
■3.87 | 0.0003 | Yes |
Was the model sound? A regression model would allow her to see if the five predictor variables (X) were associated with the outcome variable (Y), the holistic score. The pre-design failed to yield a coherent model, with the all-purpose F test (1.70)—another basic formula for comparing groups—failing to reach the critical level and also failing to achieve the desired standard significance level of .05 (p = .153). However, the post-test model yielded amazing coherence, yielding a model that accounted for 74 percent of the variance through the variables and achieving a very high (p = .001) level of probability.
That single holistic impression was often all that resulted, along with a task analysis or two, in traditional usability studies. Gloria realized she was onto something important here, a model that could yield solid statistical evidence that her redesign was effective.
An Innovation
Questions, nevertheless, remained. The number of reviewers was small, just barely reaching the thirty or so evaluators needed to justify her model. Her statistical tests would not function with a small number. But time and expense constraints made it impossible to add any more reviewers.
She returned to her spreadsheet and decided to use resampling statistics. (Devised by the late Julian Simon, professor of Business Administration at the University of Maryland, resampling statistics exploits the computational power of the desktop computer to generate data as a repeated random sample.) Would the differences from pre-redesign to post-redesign remain statistically different if there were, for example, 20,000 reviewers? That is, if the scores of the thirty-one reviewers in the pre-test sample and the twenty-seven reviewers in the post-test sample were randomly put into a wicker basket and redrawn 20,000 times in nearly endless random combinations, would the differences between the pre-design and post-design scores remain the same?
After running this new simulation in SAS 9.2, Gloria created Table 2.
Table 2: Pre-redesign and post-redesign scores: significance with 20,000 samples.
| Variable | Traditional Analysis | Resampling Analysis | ||
| Original sample p-value (from Table 1) |
Statistically Significant? (from Table 1) |
p value | Statistically Significant? | |
| 1.0 Primary Aesthetic Variables | ||||
| 1.1 Hierarchy | <.0001 | Yes | 0.0005 | Yes |
| 1.2 Proportion | .005 | Yes | 0.0388 | Yes |
| 2.0 Secondary Aesthetic Variables | ||||
| 2.1 Scale | 0.16107 | No | 0.6625 | No |
| 2.2 Tempo | 0.0964 | No | 0.4691 | No |
| 3.0 Elemental Aesthetic Values | ||||
| 3.1 Color | 0.0264 | Yes | 0.165 | No |
| 3.2 Writing | 0.1396 | No | 0.6034 | No |
| 4.0 Efficacy | <.0001 | Yes | 0.0005 | Yes |
| 5.0 Recurrence | 0.1225 | No | 0.5554 | No |
| 6.0 Holism | 0.0003 | Yes | 0.0022 | Yes |
The use of resampling statistics confirmed that her limited sample size was, after all, quite solid. The small sample of reviewers reflected the estimates of the 20,000 observations that were resampled with replacement. Only the color variable failed to achieve a statistically significant difference under resampling conditions.
Unexpected Correlations
One final set of questions remained for Gloria: what were the relationships among these variables? Since the model she had built was complex, how could she better understand the hidden relationships between the holistic score and the other five variables?
She returned to her spreadsheet and decided to run a procedure employing neural network analysis. Widely used for a variety of engineering and financial applications, neural networks are metaphorically patterned after the learning functions of the human brain: the program learns patterns and applies them to new situations. Once an acceptable neural network structure has been trained and tested, Gloria realized, it could then be used to estimate the relative importance of each independent variable to the outcome variable.
Gloria uploaded the spreadsheet into her NeuroSolutions software and ran the data twelve times for both the pre-redesign and post-redesign scores. The neural network was set so that the data converged; that is, the readjustment of the weights—the training—was set to stop when the cumulative error between the predicted and desired output values dropped below 0.01, a standard more rigorous than the 0.05 lowest probability standard. As with the traditional model, the five independent variables (X) were considered inputs associated with the dependent variable (Y), the holistic output. What was going on, Gloria wanted to know, in the black box of relationships within her model?
Gloria created one final table in which she recorded the results of the analysis.
The neural networking analysis suggested that the contributions of the variables to the model were uneven, and that lack of uniformity suggested an erratic pre-redesign—which was, of course, why the client had come to her in the first place. She could now conclusively demonstrate to her client that the original site was in need of redesign. As well, the estimated standard deviations on the pre-design model were large—yet another measure of erratic design. Truly, the original site was in bad shape.
In contrast, just as the regression model on the post-redesign analysis had demonstrated coherence, the neural network analysis revealed that the new site was also more cohesive. All those wildly different estimated mean scores had disappeared due to her post-redesign efforts, and the tighter standard deviations suggested the new design was more coherent, each independent variable contributing evenly to the holistic impact of the re-design.
Table 3: Estimated contribution of input variables to output variable (Holism)
| Input Variables | Pre-redesign | Post-redesign | ||
| Mean | Std. Dev. | Mean | Std. Dev. | |
| 1. Primary Aesthetic Variables | ||||
| 1.1 Hierarchy | 6.6 | 4 | 12.6 | 4.2 |
| 1.2 Proportion | 4.8 | 11 | 2.1 | |
| 2.0 Secondary Aesthetic Variables | ||||
| 2.1 Scale | 11.1 | 3.5 | 13 | 1.9 |
| 2.2 Tempo | 14.2 | 3.8 | 13.8 | 2.8 |
| 3.0 Elemental Aesthetic Values | ||||
| 3.1 Color | 10.7 | 3.1 | 14.5 | 2.6 |
| 3.2 Writing | 10.4 | 3.6 | 12.2 | 2.2 |
| 4.0 Efficacy | 14.7 | 3.3 | 11.5 | 4.2 |
| 5.0 Recurrence | 8.9 | 4.6 | 11.5 | 2.5 |
The Proof
It had been a long day, but there was one final step: the design of her argument; she used a model based on work by Stephen E. Toulmin.
While her sample had been small—a qualification of her claim— she had employed resampling statistics to demonstrate that the model
held under the most demanding conditions: the original differences remained, in all but a single case. To further warrant evidence of her success, she had used neural networking analysis techniques to demonstrate that the original regression analysis—one accounting for 74 percent of the variance within her variable and achieving a very high (p = .001) level of probability—had held with reduced standard deviations under post-design conditions.
But, beyond the analysis for the present client, Gloria knew there would be additional benefits. A new database had been built, and she could add to it as she designed more sites, strengthened her techniques, and refined her model. She also knew that she now had a method of dealing with the inherent problem of small sample sizes in empirical usability studies. And she had an analytic technique that could be constantly trained and updated to test and refine her models as they grew. She was using the machine to help her think.
That was, after all, the idea.