Without web analytics data, you are missing part of the picture when it comes to planning and analyzing usability testing of a website. While testing typically provides deep insight into the behavior of a small sample of people, analytics complements this by providing data about what large groups of users have done. Prior to launching a usability study, analytics can help identify areas to explore and prioritize your research questions. After the study, analytics can help better understand findings from a usability test and supply evidence to support them.
This article provides an overview of how to approach combining web analytics with user testing. Although the techniques discussed are applicable regardless of the web analytics tool you choose, our examples are based on the widely used and free Google Analytics.
Using Analytics to Design a Study
Prioritizing Tasks with Page Views
In formative usability testing, analytics data can help you think of tasks that may uncover problems. When prioritizing what tasks make it into your test, the number of page views can help determine how important a page is to users (see Figure 1). If a page gets a lot of traffic, that might be a signal that it is an important page to test. If you think a page should be getting more page views than it currently does, you can create tasks that test whether users are able to find the page and what they do once they get there.
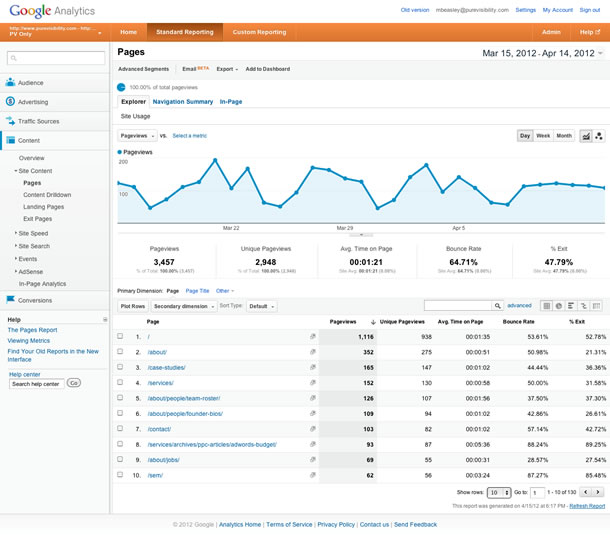
For example, in a project for a university, we noticed that the number of page views for the registrar’s office section seemed low. This page provided a link to a tool used to register for classes. The page wasn’t in the website’s main navigation, and analytics showed that pages in the primary navigation received far more page views than pages that couldn’t be directly accessed from the primary navigation. While it’s possible that the registrar’s office page was getting an appropriate number of page views based on how often students needed to access it, the situation prompted questions that could be adapted into tasks and questions in a user test, such as how students were actually getting to the registrar’s office page, and what other steps they were taking to register for classes.
Using Outliers to Identify Problem Areas
Sometimes in web analytics, the examination of high-level metrics known as “behavioral metrics” can raise questions about user behavior. The measures worth looking at are:
- Time on Page: How long do users stay on a page relative to other pages? Do any pages have an unusually long or short time on page compared to the rest of the site?
- Bounce Rate: How many people are viewing just one page and leaving before going to any other pages? Are there any pages that have an unusually high or low bounce rate in comparison to other pages?
- Exit Rate: From which pages are most people exiting the site?
For these three metrics you should be looking for outliers—values for a given page that are radically different from values for other pages. You can explore what’s behind these measurements by constructing tasks that lead participants to interact with the pages in question. There may be good reasons for an outlier measurement. For example, a navigational “hub,” a page with no real content that mainly leads users to other pages, will probably have a short time on page since users have no reason to stay there.
Time-on-page data can also help you come up with a benchmark for your first summative test. You can find the pages involved in completing a task and add up the average time users spend on them. Clearly, these are not perfect data because users may be on those pages for any number of reasons, but you at least have a starting point based on actual measurement.
Examining User Paths
Data about user paths can help you construct more realistic tasks. A useful report is the Landing Pages report in Google Analytics, which shows where users entered the site. The experience of visiting a website is different for a user who landed on the homepage than it is for a user who landed on an internal page. Therefore, depending on the goal of the usability test, you may wish to have users start on a common non-homepage landing page for a task.
Analytics data also tell you which pages users came from immediately before reaching a page, and where they went upon leaving a page (in Google Analytics, this is the Navigation Summary report). With this report you can assess how many users are actually following the paths you expect them to take, and identify unexpected ways in which they move through the site.
Usability testing can help you better understand why people go from one page to another. We recently conducted usability testing for a childcare provider with almost a thousand locations in the U.S. According to the analytics data, users researching childcare options tended to use the main site navigation rather than the subnavigation of the individual childcare centers. To understand why the subnavigation was underutilized, we planned tasks that involved open-ended exploration, as well as finding specific pieces of information. Most participants did not identify the main navigation and center-specific subnavigation as two separate systems. Also, the items in the main navigation seemed to correspond better with users’ information needs. Combining the results from web analytics and user testing allowed us to make a stronger case and justify design changes.
Using Analytics Goals
If you have goals configured on your analytics program—that is, if you have identified key user actions on the website that contribute to your company’s success—these goals form an excellent basis for deciding what to include in a user test. Goals that involve a sequence of steps, such as a shopping cart checkout or multiple page registration, can give you a starting point for estimating a completion rate benchmark because, with web analytics, you can measure how many start and then complete the goal.
Using Analytics in Your Findings
Verifying Your Findings
After testing, web analytics is valuable for confirming findings and giving you a better sense of how common a problem may be. Begin by reviewing your initial analysis of the analytics data in light of what you learned from usability testing. For example, web analytics may have revealed an unusually low time on page for a particular web page. If you assumed that was because the content did not correspond to users’ needs, data from the user test can verify if your hypothesis was correct.
Sometimes, analytics data can contradict your findings from usability testing. In the usability test of the childcare provider’s website mentioned earlier, 60 percent of participants went straight from their initial starting page to the Our Philosophy section. However, when we dug into the analytics data, we found that fewer than 1 percent of users went directly from the homepage to the Our Philosophy page, and only 9 percent of the site visitors ever got around to visiting the Our Philosophy page. What could explain this inconsistency in findings? We concluded that this was an instance of the lab setting influencing participant behavior. Our participants thought that, as good parents, they were supposed to show interest in the childcare center’s philosophy, when in fact they were much more interested in the tuition costs.
Questions to ask could include whether a well-visited page was really all that important to the participants, and if so, in what way. For pages that your participants visited, do the analytics’ average time on page, bounce rate, and exit rate numbers make sense when compared to what you learned from participants? Can these measures help explain how participants interacted with the site?
Of course, there is always the possibility that analytics data will make you question something from a usability test or lead you to different recommendations. When analytics data appear to contradict user test results, it is important to attempt to interpret the data in a way that tells a story that resolves the contradiction, rather than simply discard one kind of data or the other. Even when analytics data minimize the impact of a usability problem observed during user testing, you still observed that problem. It just may not affect as many users as you had thought based on the test, meaning that you should lower your prioritization of the usability problem.
Making a Stronger Case
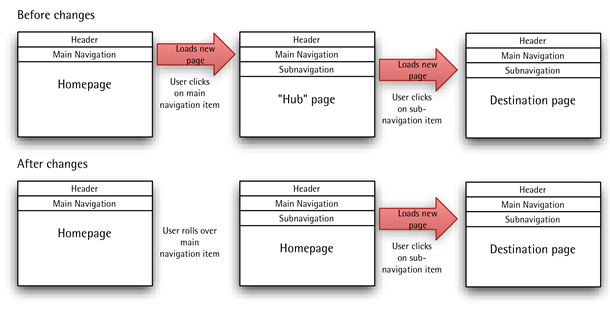
You can bolster your report with hard numbers that speak to stakeholders skeptical of the small sample sizes typical of usability testing. One of the recommendations to come out of an earlier round of usability testing of the daycare website was to modify the site’s navigation. Instead of users having to click on a main navigation item and go to a hub page to see what subpages were in that section, we suggested removing the hub page and implementing menu rollovers (see Figure 2).
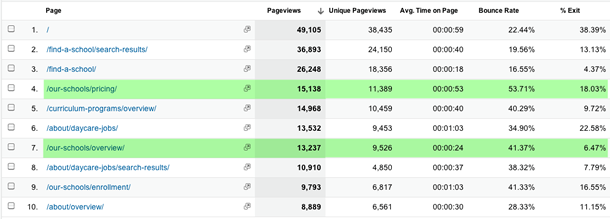
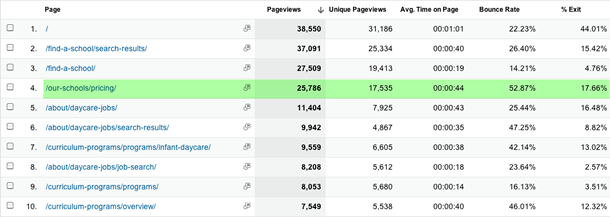
We were able to make our case by presenting page views for these content-light hub pages to show how many users would be affected by the change. Figure 3 shows that these hub pages were among the most viewed pages on the website, despite providing little value to users. In contrast, Figure 4 shows that after our recommended design changes were implemented, these pages no longer received as many visitors.
The best approach to integrating web analytics with usability test reports is to fold references to analytics data into the narrative that explains the uncovered problems and proposed solutions. You can also discuss ways design recommendations are intended to change metrics, such as increase or decrease time on page, or increase the number of visitors to a page. The risk of breaking out analytics data into their own section is that it will make it harder for stakeholders to understand the full story of how all of your findings tie together.
After the Usability Test
Looking beyond user test planning and analysis, web analytics also provide a way to measure the effectiveness of design changes after they have been made. You can look to the metrics you targeted when creating your design recommendations to see if they have changed in the way you intended. This gives us the opportunity for greater accountability—the ability to more quickly change course when design changes do not work out as planned, and a way to better show the benefits of our work.网页分析数据是一个有助于可用性测试设计和测试结果分析的定量数据源。在计划阶段,你可以通过查看用户的页面浏览数据来考虑测试任务的优先顺序。页面停留时间、跳出率和退出率是衡量用户与页面交互行为的高级指标。通过在任务中包括引起异常行为的页面可以了解用户为什么会以不同的方式与这些页面进行交互。
了解用户从哪个页面进入你的网站有助于构建能够反映用户浏览网站的实际路径的真实任务。你可以通过观察用户如何进入和离开一个页面来找出潜在的问题领域和行为。分析工具中所包含的业务目标能够为揭示用户的哪些行为对业务最有价值提供洞察,有助于让测试任务与业务目标保持一致。
测试后,你可以通过查看参与者的行为与其他用户行为的符合程度(例如在离开某个特定页面后会访问什么页面)来从分析数据中验证测试的结果。将分析得到的量化数据包含在报告中可以让测试结果更有力。
文章全文为英文版웹 분석은 사용성 평가를 계획하고 평가 결과를 분석할 수 있도록 돕는 정량적 데이터 소스입니다. 계획 중, 사이트에서 현재 사용자들이 방문하는 페이지뷰 데이터를 검토함으로써 업무에 우선순위를 정할 수 있습니다. 페이지 방문 시간, 반송률 그리고 종료율 등은 사용자가 페이지와 어떻게 상호작용하는지를 알려주는 높은 수준의 측정 기준이며, 이상치는 사용자들이 왜 이러한 페이지에 다르게 상호작용하는지를 이해하기 위한 업무를 알려줍니다.
사용자가 당신의 사이트에 왔을 때 어느 페이지에 머무는지를 아는 것은 사용자들이 사이트를 탐색할 때 이동하는 실제 경로에 반응하는 실제 과제를 구축할 수 있도록 돕습니다. 사용자가 어디에서 페이지로 오며 그 후에 어디로 가는지를 관찰함으로써 알기 원하는 잠재적인 문제 영역이나 행동을 찾아낼 수 있습니다. 당신의 분석 도구에 설정된 사업 목표는 어떤 사용자 행동이 당신의 과제를 사업 목표와 일치시킬 수 있도록 도움으로써 사업목표에 도움이 되는지를 알 수 있는 통찰력을 제공합니다.
테스트 후 특정 페이지에서 나간 후 어떤 페이지를 방문하는지 등을 포함한 참가자의 행동이 다른 사용자 행동과 얼마나 일치하는지를 봄으로써 분석 데이터를 통한 연구 결과를 확인할 수 있게 됩니다. 리포트에 분석을 통한 통계 수치를 포함하는 것은 연구 결과를 위한 더욱 강력한 사례를 만들 수 있게 합니다.
전체 기사는 영어로만 제공됩니다.A web analítica é uma fonte de dados quantitativos que pode ajudá-lo a planejar testes de usabilidade e analisar os resultados do teste. Durante o planejamento, você pode priorizar tarefas analisando os dados de visualização da página aonde os usuários atualmente vão em seu site. Tempo na página, taxa de retorno e taxa de saída são medidas de alto nível de como os usuários interagem com as páginas, e páginas isoladas que poderiam ser incluídas em tarefas para entender por que os usuários interagem com essas páginas de forma diferente.
Saber sobre quais são as páginas em que os usuários chegam quando vão ao seu site pode ajudá-lo a construir tarefas realistas que refletem caminhos reais que os usuários seguem ao navegar pelo site. Você pode encontrar possíveis áreas ou comportamentos problemáticos que deseja entender olhando de onde os usuários vêm para chegar a uma página e aonde vão depois. Os objetivos de negócio configurados em sua ferramenta analítica proporcionam uma visão quanto a quais ações do usuário são valiosas para o negócio, ajudando você a alinhar suas tarefas com os objetivos de negócio.
Após o teste, você pode verificar as descobertas com os dados analíticos analisando quanto o comportamento dos participantes corresponde ao comportamento dos outros usuários, como quais páginas eles visitam após deixar uma página em particular. Incorporar números da análise em seu relatório o ajudará a formar uma base mais sólida para as suas descobertas.
La versión completa de este artículo está sólo disponible en inglés.ウェブ解析の結果は定量的データソースであり、ユーザビリティ・テストの計画やテスト結果の分析を行う際に役立つものである。計画の段階では、ユーザがサイトのどこに移動するのかをページ閲覧データを見て、作業に優先順位を付けることができる。滞在時間、飛越率、それと離脱率は、ユーザが各ページでどのような対話操作をしたかとか、なぜそれらのページで異なる動作をしたのかを理解するための、高水準の測定法である。
またユーザがサイトの中のどのページに到着したのかを知ることは、ユーザがサイトのナビゲーションにおいてたどる実際の経路が反映されたリアルな作業を構成するための手助けとなる。そのページにどこからやって来て、その後どこに行くかを調べることで、潜在的に問題のあるエリアやユーザの行動を見つけ出すことが可能となる。ビジネス上のゴールを解析ツールに組み込むことによって、どのようなユーザ行動がビジネスにとって貴重であるかについて洞察が得られ、この分析作業の内容をビジネスゴールに沿わせるのに役立つ。
テスト終了後には、特定のページからどのページに移行したかといった解析データを利用して、テスト参加者の行動が他のユーザの行動とどれだけよく一致しているかを見ることによって、テスト結果の検証ができる。解析から得られた数値をレポートに含めることで、テスト結果についてより強固な主張をすることができる。
原文は英語だけになりますLa analítica web es una fuente de datos cuantitativos que puede servirle para planificar tests de usabilidad y analizar los resultados de los tests. Durante la planificación, puede priorizar las tareas que se realizarán revisando los datos de las visitas actuales a las páginas del sitio (page views). El tiempo de permanencia en la página, la tasa de rebote y el porcentaje de salida son medidas eficaces de cómo los usuarios interactúan con las páginas, y permiten identificar páginas destacadas que podrían ser incluidas en la programación de tareas que permitan entender por qué los usuarios interactúan con esas páginas de manera diferente.
Saber en qué páginas aterrizan los usuarios cuando llegan a su sitio puede ayudarle a construir tareas realistas que reflejen los caminos reales que toman los usuarios cuando navegan el sitio. Si observa de dónde vienen los usuarios para llegar a una página y a dónde van después, puede detectar posibles áreas problemáticas o conductas que desearía comprender. Los objetivos comerciales configurados en su herramienta de analítica web arrojan información sobre qué acciones del usuario son valiosas para su negocio, ayudándole a alinear sus tareas con los objetivos comerciales.
Después de haber realizado tests, los datos extraídos de la analítica web permiten verificar sus hallazgos examinando cómo el comportamiento de los participantes del test concuerda con el de otros usuarios, por ejemplo, qué páginas visitan después de salir de una en particular. Incorporar cifras de los datos de analítica web en el informe le ayudará a fundamentar mejor sus hallazgos.
La versión completa de este artículo está sólo disponible en inglés.