Surveying to Evaluate Feature Launches
As UX researchers, our input helps product teams decide which features to build, how to design those features to meet user needs, and when new features are ready to launch. The final stages of the development cycle typically involve running surveys to evaluate how a new product or feature is landing with users. In our experience, researchers usually write bespoke surveys to evaluate each new feature individually. While this approach allows teams to tailor survey questions to the feature in question, it introduces several problems:
- Repeat work as researchers draft and test similar but new questions for each feature
- Slower launch cycles due to the time required for survey development
- Inability to compare user reactions across features that were evaluated using different questions
- Limited benchmarks for user sentiment (for instance, uncertainty about what constitutes a “good” versus “bad” rating), which makes it difficult to reach decisions based on survey data
UX researchers can overcome these problems by creating feature-agnostic survey templates to evaluate all new features in a product space and conducting meta-analyses that aggregate responses from previous launches. In combination, these tools enable product teams to build a cumulative body of knowledge with deeper insights than any single study could provide.
This article shares best practices we developed while using survey templates and meta-analysis on several teams at Google™. We outline the benefits of this approach and offer practical suggestions for researchers interested in aggregating user insights across multiple launches.
Replication and Aggregation
Replication is a cornerstone of scientific research. Insights build upon one another, with researchers developing more accurate theories by replicating and extending prior work. As per Alison Ledgerwood’s article, the most precise, reliable, and trustworthy conclusions come from the aggregation of insights across multiple studies.
Replication and aggregation are critical because every study has limitations. For example, most UX research studies collect responses from a sample of participants to reach conclusions about a larger population. Because the sample only captures a subset of the total population, results necessarily include some amount of error, for instance, discrepancies between the sample and the true population. Even well-designed studies have some amount of error due to random differences between the sample and the population, which limits the conclusions researchers can draw from a single dataset.
Researchers can overcome these limitations using meta-analysis, which combines data from previous studies to test whether the findings replicate across multiple samples. By aggregating numerous studies in a single analysis, this approach increases the precision of research conclusions.
Although standard in academic research, meta-analysis is not widely adopted among UX researchers in industry because product teams often use bespoke survey questions to evaluate each feature. For example, a team testing a grammar-correction feature might ask users whether they felt the feature improved the accuracy of their writing, whereas a team testing a collaboration feature might ask whether the feature made it easier to work with colleagues. Measuring different constructs for different launches stands in the way of aggregating insights over time using meta-analysis. It also makes it difficult to answer questions like: “What’s a good score?” Without a comparative baseline from previous launches, researchers must make decisions based on data from a single sample.
Developing and deploying standard survey questions to measure user sentiment would allow UX research to become a more cumulative science. It would enable researchers to aggregate findings across multiple studies via meta-analysis and develop success benchmarks based on previous launches. In the remainder of this article, we walk through an example of how our teams used survey templates and meta-analysis to develop products for Google Workspace™.
Developing a Survey Template
In 2019, Google Workspace was developing a variety of features that used artificial intelligence and machine learning to help users be productive. Our teams needed a framework to evaluate user sentiment toward these assistive features, but we encountered several challenges:
- There were multiple product teams working on assistive features simultaneously.
- Although the teams worked on similar user problems, they had distinct stakeholders.
- Assistive intelligence was a new space, so we didn’t have metric benchmarks from previous launches. Instead, teams were relying on surveys to make launch decisions.
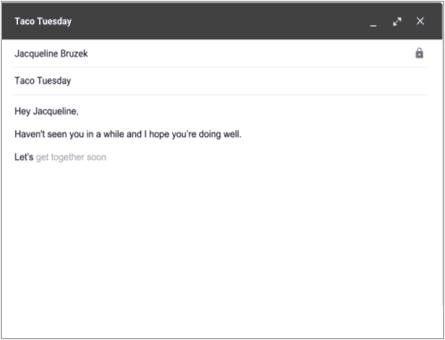
Figure 1: Example of assistive technology. Smart Canvas™ automatically completes phrases while users type.
We saw an opportunity to develop a standard set of survey questions to guide launch decisions. After getting stakeholder buy-in for a unified approach to sentiment analysis, we constructed the template in four steps following best practices from quantitative assessment.
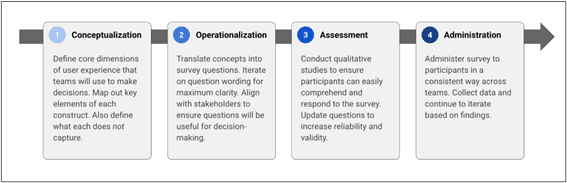
Figure 2: Steps in a unified approach to building surveys for sentiment analysis.
Working in a fast-paced environment, we couldn’t fully develop the template before implementation. Instead, we crafted the template alongside ongoing feature development. We used open-ended questions when we first began, but as we gathered more data and confidence, we began converting them into more closed-ended questions. We then deployed potential survey questions in small experiments and iterated based on the results. Iteratively testing and refining the template ensured we captured the needs of various teams.
We eventually settled on several core metrics to determine the launch-readiness of new features, including frequency of exposure, satisfaction, distraction, and usefulness (see the Appendix for the complete template). Over time, the template became widely adopted because it streamlined research and provided shared language for making decisions about assistive features. In fact, teams used the template to evaluate more than 40 launches over the course of 2 years, resulting in over 75,000 participants responses. Such a large dataset provided new learning opportunities for our teams.
Meta-Analysis for Product Teams
By assessing the same constructs for various assistive features, the template enabled us to aggregate survey data using meta-analysis. There is robust literature explaining the methods and best practices of meta-analysis. Many of the tools were developed to enable researchers to conduct meta-analyses without access to underlying data by using only the summary statistics provided in published papers (see Further Reading).
In our case, we had access to the original data, so we simply combined participant responses into one large dataset from each study that used the survey template. While creating the combined dataset, we captured information about each of the surveys that we could use in the analysis, for example, which type of user the survey targeted (internal users versus external users).
Other variables included these:
- User group—Which users were sampled? (internal, consumer, enterprise, or education)
- Geography—Which country were users sampled from?
- Survey delivery mechanism—How was the survey presented to participants? (within-product or email)
- Launch stage—When in the launch process was the survey administered? (dogfood, alpha, beta, or public launch)
Once we had created a single dataset containing responses from previous surveys, we dug into the analysis. We developed two types of insights for the team. First, we provided benchmarks for each question in the survey template to show the average score and distribution of ratings from prior launches. These insights have been useful in answering questions such as: “What is a good satisfaction score for an assistive feature before launch?” Rather than setting arbitrary success criteria, our teams could now set goals and make launch decisions based on data-driven benchmarks.
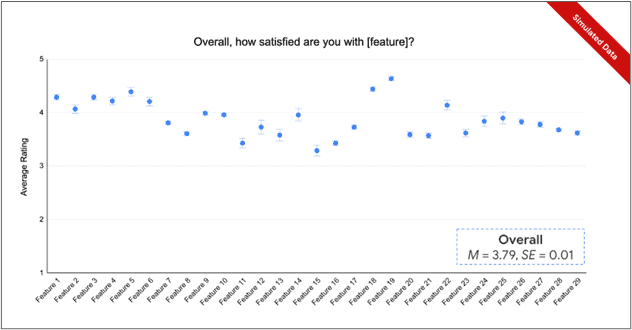
Figure 3: A graph of simulated satisfaction ratings across multiple launches.
Second, we compared survey responses across key subgroups (for example, enterprise versus consumer users). These insights have been useful in contextualizing findings and setting nuanced expectations for survey results based on characteristics of the sample. They also helped dispel some common myths about survey responses. For example, prior to the meta-analysis, there was a widespread assumption that internal (dogfood) survey participants were more likely than external users to be critical of new features. However, our meta-analysis suggested this assumption was wrong. In fact, there was a small but significant effect in the opposite direction! If anything, internal users provided more positive feedback than external users. By correcting this assumption across product teams, meta-analysis unlocked more accurate data-driven decisions.
Conclusion
Academic researchers regularly aggregate insights through replication and meta-analysis to develop more precise estimates of the phenomena they study. UX researchers working in industry can benefit from the same process by developing survey templates that standardize the questions product development teams use to assess the launch-readiness of new features. Survey templates save time and create consistency across teams, which enables researchers to aggregate insights across multiple studies. Such cumulative knowledge allows product development teams to build a more robust understanding of user attitudes, set reasonable benchmarks for launch-readiness based on prior data, and make fine-grained comparisons about whether and how attitudes differ across contexts. We hope this guide makes it easier for other teams to enjoy the benefits of survey templates and meta-analysis.
Appendix: Survey Template
Further Reading
“Meta-Analysis” by Larry V. Hedges in the Journal of Educational and Behavioral Statistics 17(4)
Practical Meta-Analysis by M. W. Lipsey and D. B. Wilson

David J. Lick, PhD, is a mixed-methods researcher with 15 years of experience studying human behavior. He currently manages a UX Research team at Google focused on artificial intelligence and human productivity. Prior to Google, David held research positions at Facebook and Vine.

Martin Ortlieb, PhD, User Experience Researcher at Google, has been applying design thinking and the whole range of HCI research methodologies for over 20 years to develop services, products, and their interfaces. His current focus investigates how to keep knowledge workers productive, happy, and committed at work. He researches processes of integrating the best work tools with human social needs to build effective teams and a resilient company culture.
1 Comment
Andrew Schall
Test